Category:Pressure-volume diagrams
Jump to navigation
Jump to search
Bosanski: Dijagram volumenskog pritiska
· Čeština: Indikátorový diagram
· Dansk: PV-diagram
· Deutsch: P-v-Diagramm
· English: Pressure–volume diagram
· Español: Diagrama p-v
· Français : Diagramme de Clapeyron
· Italiano: Piano di Clapeyron
· Magyar: Indikátordiagram
· Nederlands: Indicateurdiagram
· Қазақша: Индикатор диаграммасы
· Português: Diagrama PV
· Română: Diagramă indicată
· Русский: Индикаторная диаграмма
· Українська: Індикаторна діаграма
· diagram in thermodynamics, ploting pressure versus volume, typically used for thermodynamic processes | |||||
| Upload media | |||||
| Instance of | |||||
|---|---|---|---|---|---|
| Subclass of | |||||
| Named after | |||||
| Creator | |||||
| Inception |
| ||||
| |||||
Subcategories
This category has the following 2 subcategories, out of 2 total.
I
V
- Van der Waals isotherms (18 F)
Media in category "Pressure-volume diagrams"
The following 165 files are in this category, out of 165 total.
-
 Absolute Work PV.svg 296 × 310; 14 KB
-
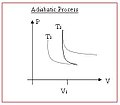
 Adia.gif 481 × 441; 7 KB
-
 ADIAB1.png 516 × 384; 7 KB
-
 ADIAB2.png 516 × 384; 8 KB
-
 ADIAB3.png 516 × 384; 8 KB
-
 Adiabata uk.png 457 × 450; 15 KB
-
 Adiabata.png 400 × 400; 9 KB
-
 Adiabate-Isotherme.png 644 × 513; 27 KB
-
 Adiabatic-process-in-p-V-diagram.svg 201 × 180; 26 KB
-
 Adiabatic-processes-in-p-V-T-diagram.svg 454 × 432; 19 KB
-
 Adiabatic.jpg 289 × 253; 11 KB
-
 Adiabatico.svg 301 × 259; 1 KB
-
 Adiabatique.png 341 × 273; 8 KB
-
 AdIsobIsoc.png 647 × 571; 7 KB
-
 Alfa uguale beta.jpg 400 × 300; 9 KB
-
 Algebra1 03 fig036 propinv.svg 238 × 204; 33 KB
-
 ArgonKLdivergence.png 384 × 355; 27 KB
-
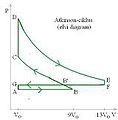 Atkinsonkicsi.JPG 160 × 163; 4 KB
-
 Bakharev Cycle P-V diagram.jpg 707 × 441; 34 KB
-
 BET Isotherme.svg 322 × 227; 30 KB
-
 Boyle's law final.gif 384 × 324; 299 KB
-
 Boylemariotte1.jpg 333 × 327; 10 KB
-
 Boyleov Zakon.png 2,000 × 1,950; 164 KB
-
 Boyles Law animated.gif 532 × 403; 53 KB
-
 Boyles Law.svg 363 × 354; 38 KB
-
 Brayton cycle.svg 745 × 293; 56 KB
-
 Carnot cycle p-V diagram.svg 1,000 × 800; 14 KB
-
 Carnot cycle PV.png 800 × 593; 37 KB
-
 Carnot-Prozess Vakuum-Motor.svg 286 × 186; 12 KB
-
 Ciclo anomalo.png 482 × 438; 6 KB
-
 Ciclo Stirling.svg 637 × 648; 19 KB
-
 Compliance vascular.png 360 × 310; 2 KB
-
 Compressibilité isotherme de SF6 - bis.png 509 × 446; 46 KB
-
 Compressibilité isotherme de SF6 - ter.png 509 × 446; 44 KB
-
 Compressore alternativo pv.png 530 × 278; 16 KB
-
 CR-Prozess p-v-Diagramm.svg 400 × 296; 11 KB
-
 Cyclic process.PNG 266 × 238; 4 KB
-
 DamierTS.svg 612 × 764; 82 KB
-
 DESP categorie risque recipient sous pression gaz groupe 1.svg 462 × 410; 31 KB
-
 DESP categorie risque recipient sous pression gaz groupe 2.svg 462 × 410; 31 KB
-
 DESP categorie risque recipient sous pression liquides groupe 1.svg 462 × 410; 26 KB
-
 DESP categorie risque recipient sous pression liquides groupe 2.svg 462 × 410; 25 KB
-
 DESP categorie risque recipient sous pression production vapeur.svg 462 × 410; 29 KB
-
 Diagrama p-V.JPG 530 × 529; 18 KB
-
 Diagrama Pressão x Volume.png 867 × 681; 9 KB
-
 Diagramme P-V compression isotherme.svg 1,083 × 1,099; 16 KB
-
 Diagramme p-v évolutions infiniment lentes gaz parfait.svg 1,231 × 1,222; 13 KB
-
 Diagramme Pression-Volume.jpg 404 × 353; 30 KB
-
 Diagrammes p-v évolutions rapides d'un gaz parfait.svg 1,340 × 2,409; 18 KB
-
 Diesel-Prozess im p-v-Diagram.jpg 590 × 515; 52 KB
-
 DieselCycle PV.svg 420 × 420; 43 KB
-
 DieselCycle PVnl.svg 420 × 420; 25 KB
-
 EB1911 Thermodynamics - Fig. 3.png 501 × 463; 41 KB
-
 ELV Diagrama p-v del n-butano.png 826 × 601; 109 KB
-
 ELV Zonas del Diagrama p-v del n-butano.png 796 × 579; 147 KB
-
 Es14p20.png 593 × 519; 10 KB
-
 Es14p58.png 644 × 509; 6 KB
-
 Example-process-in-p-V-diagram.svg 201 × 180; 47 KB
-
 Gas Dynamics.png 732 × 638; 16 KB
-
 Gas pV.jpg 400 × 300; 6 KB
-
 Gas pV=k.jpg 400 × 300; 15 KB
-
 Gas pVp.jpg 400 × 300; 21 KB
-
 Gasturbinenprozess 2-stufig.jpg 1,553 × 689; 178 KB
-
 Generic carnot not ideal gas.png 532 × 257; 13 KB
-
 Grafico p-v.JPG 586 × 568; 15 KB
-
 Grapho1.jpg 246 × 236; 6 KB
-
 Gráfico Pressão x Volume.jpg 647 × 330; 15 KB
-
 Gráfico Pv.gif 1,200 × 805; 23 KB
-
 Gráfico PV.jpg 332 × 320; 12 KB
-
 Gráfico PxV.jpg 318 × 330; 12 KB
-
 Humphrey cicle pV.svg 370 × 400; 10 KB
-
 Indicator diagram steam admission.svg 479 × 370; 34 KB
-
 Insetropic,polytropic,isothermal.jpg 500 × 500; 20 KB
-
 Isobaric-process-in-p-V-diagram.svg 201 × 180; 20 KB
-
 Isochoric process SVG-ru.svg 704 × 799; 4 KB
-
 Isochoric process SVG.svg 224 × 246; 23 KB
-
 Isochoric-process-in-p-V-diagram.svg 201 × 180; 20 KB
-
 Isoprocesses.jpg 451 × 236; 6 KB
-
 Isotermes CO2 d'Andrews.png 610 × 738; 148 KB
-
 Isotherm work.png 1,972 × 2,078; 78 KB
-
 Isotherm work.svg 1,972 × 2,078; 1 KB
-
 Isotherm.png 602 × 604; 2 KB
-
 Isothermal and isentropic process.svg 1,440 × 1,080; 182 KB
-
 Isothermal expansion of an ideal gas.png 698 × 462; 31 KB
-
 Isothermal process.svg 375 × 375; 42 KB
-
 Isothermal-process-in-p-V-diagram.svg 201 × 180; 24 KB
-
 Isotherme bet.png 713 × 532; 1.45 MB
-
 Isothermen.jpg 490 × 493; 23 KB
-
 Isotherms.png 1,650 × 1,657; 70 KB
-
 Isotherms.svg 1,650 × 1,650; 813 bytes
-
 Izoterm pV diagram.svg 1,800 × 1,440; 16 KB
-
 Izoterm pV munka.svg 1,800 × 1,440; 19 KB
-
 Joule p-v-Diagramm.jpg 713 × 574; 83 KB
-
 Kredsproces.PNG 942 × 667; 17 KB
-
 Legge di Boyle dati originali.jpg 587 × 552; 54 KB
-
 Lenoir pv.svg 410 × 410; 22 KB
-
 Millerelőttkicsi.JPG 160 × 163; 4 KB
-
 Millerutánkicsi.JPG 160 × 163; 4 KB
-
 MM pv plane 01.png 906 × 810; 67 KB
-
 MM pv plane 02.svg 1,280 × 720; 101 KB
-
 MM pv plane 03.png 901 × 815; 67 KB
-
 Motor 2 timpi.png 497 × 537; 11 KB
-
 Mplwp 1overxpow5over3.svg 600 × 400; 22 KB
-
 Mplwp 1overxpow7over5.svg 600 × 400; 22 KB
-
 Mplwp 1overxpow8over6.svg 600 × 400; 23 KB
-
 Mplwp 1overxpow9over7.svg 600 × 400; 23 KB
-
 MRF-Ventil Elektromagnet.png 969 × 578; 45 KB
-
 MRF-Ventil Kombination Permanent- und Elektromagnet.png 921 × 602; 30 KB
-
 MRF-Ventil Permanetmagnet.png 945 × 544; 22 KB
-
 Multilayer isotherm plot.JPG 700 × 500; 25 KB
-
 P V Diagramm uk.png 487 × 600; 79 KB
-
 P V Diagramm.jpg 601 × 740; 48 KB
-
 P-V compressore alternativo.svg 1,024 × 576; 23 KB
-
 P-V diagram deviations to Otto cycle.svg 338 × 316; 21 KB
-
 P-v diagram for a liquid-vapor.svg 1,296 × 1,037; 14 KB
-
 P-v diagram for a two-stroke cycle engine.svg 1,228 × 2,217; 24 KB
-
 P-v diagram four stroke piston engine.svg 1,231 × 1,222; 6 KB
-
 P-v diagram of a simple cycle.svg 1,229 × 1,224; 12 KB
-

-
 P-v diagram reversible evolutions.svg 1,231 × 1,222; 13 KB
-
 P-v diagram specific work closed system.svg 1,231 × 1,354; 14 KB
-
 P-V diagram, Isobaric Process.jpg 504 × 360; 56 KB
-
 P-v diagrams elementary evolutions.svg 2,741 × 1,222; 13 KB
-
 P-V Otto cycle.svg 338 × 333; 20 KB
-
 P-V otto.png 322 × 295; 12 KB
-
 P-v-Diagramm N2.jpg 882 × 880; 176 KB
-
 PdV work cycle.gif 144 × 144; 4 KB
-
 Pivo.jpg 309 × 236; 6 KB
-
 Politropica-p-v.png 259 × 207; 5 KB
-
 Polytrope Zustandsänderung.jpg 800 × 600; 47 KB
-
 Polytropic.gif 487 × 468; 75 KB
-
 Presionvapor.svg 600 × 480; 17 KB
-
 Pressure-specific volume chart for steam, in US units.svg 1,301 × 1,301; 552 KB
-
 Processo Isotérmico.jpg 277 × 217; 8 KB
-
 Pv Chart of Water.svg 638 × 478; 53 KB
-

-
 PV diesel.gif 472 × 439; 4 KB
-
 PV loop example of left ventricle.svg 690 × 544; 13 KB
-
 PV plot adiab sim.png 657 × 456; 7 KB
-
 PV real1.PNG 459 × 292; 52 KB
-
 PV-Diagramm.jpg 495 × 352; 39 KB
-
 PV-Humphrey cycle.png 539 × 397; 8 KB
-
 PVdiagram ideaalgas.png 640 × 480; 4 KB
-
 PvDiagramm-Diesel 0110.png 1,201 × 900; 14 KB
-
 PvDiagramm-Seiliger.png 1,201 × 900; 14 KB
-
 P—V-диаграмма для вычисления термической эксергии цикла.png 527 × 553; 13 KB
-
 Real two stroke diagram.gif 464 × 308; 3 KB
-
 Sample adiabatic curve.png 671 × 419; 14 KB
-
 SER-ZDEH09.03.26 1Ejpg(pV Ts Tab VergleicheNSC,D,SC nur kvalitativ.JPG 1,094 × 485; 105 KB
-
 Simple heat engine.jpg 998 × 702; 102 KB
-
 T cycle Brayton.png 2,884 × 1,718; 14 KB
-
 T-s and p-v diagrams for Otto and Diesel cycles.svg 3,215 × 3,884; 45 KB
-
 Techn Arbeit Volumenarbeit 1.jpg 475 × 500; 38 KB
-
 Technical Work PV.svg 310 × 314; 19 KB
-
 Themodynamic state function example PV.svg 1,052 × 744; 49 KB
-
 Theoretical Sabathe process.gif 699 × 531; 5 KB
-
 Trasformazione ciclica.png 1,124 × 917; 26 KB
-
 Trasformazione isocora.jpg 400 × 300; 12 KB
-
 Trasformazioni politropiche.jpg 549 × 384; 14 KB
-
 VdW-Attr-Repul SVG path.svg 657 × 599; 189 KB
-
 VdW-Attr-Repul SVG text.svg 657 × 599; 94 KB
-
 Volume v. Pressure.pdf 1,650 × 1,275; 93 KB
-
 Wet vapor specific enthalpy calculation with dryness fraction.svg 1,295 × 1,037; 14 KB
-
 Wet vapor specific volume calculation with dryness fraction.svg 1,295 × 2,065; 21 KB
-
 Wykres P-V przemiany izochorycznej.svg 750 × 750; 11 KB


