Category:Oil production trends
Jump to navigation
Jump to search
See also:
Media in category "Oil production trends"
The following 108 files are in this category, out of 108 total.
-
 1000px-Production of oil shale.png 1,000 × 555; 100 KB
-
 Alaska Oil Production 1975 to 2005.png 500 × 500; 9 KB
-
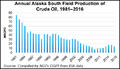 Annual-Alaska-South-Field-Production-of-Crude-Oil-20170327.png 540 × 312; 37 KB
-
 Athabasca Oil Sands Planned Production.png 1,409 × 959; 153 KB
-
 August 2013 peak oil models.png 722 × 546; 206 KB
-

-
 Canadian oil production 1950 to 2030.svg 512 × 341; 16 KB
-
 Canadian Oil Production 1960 to 2020.png 500 × 500; 7 KB
-
 Canadian Oil Production since 1960.svg 512 × 512; 20 KB
-
 China Oil Production vs Consumption.png 2,200 × 1,700; 30 KB
-
 Oil Balance Colombia.svg 1,170 × 630; 83 KB
-
 Colombia oil production.png 2,100 × 1,350; 31 KB
-
 Crude NGPL IEAtotal 1960-2008-ar.svg 512 × 289; 36 KB
-
 Crude NGPL IEAtotal 1960-2008.svg 512 × 289; 17 KB
-
 Crude oil prod 2009 EIA DoE.png 450 × 306; 18 KB
-
 Cuba-oil-production.png 507 × 332; 6 KB
-
 Decouvertes-petrole.png 931 × 471; 22 KB
-
 EIA 2004 - Peak World Oil.jpg 660 × 352; 98 KB
-
 EIA Forecast1.6mbdDrop 160506 2clip.png 573 × 365; 41 KB
-
 EIA Oct2015 BakkenNewWellProdnPerRig.pdf 1,058 × 281; 109 KB
-
 EIA Oct2015 BakkenNewWellProdnPerRig.png 1,059 × 281; 83 KB
-
 EIA Oct2015 BakkenOilGasProduction.pdf 1,041 × 335; 112 KB
-
 EIA Oct2015 BakkenOilGasProduction.png 1,042 × 336; 49 KB
-
 Federal Gulf of Mexico Oil Production 1981-2012.png 1,250 × 939; 22 KB
-
 GlennPool.jpg 400 × 388; 45 KB
-
 GlobalPeakOil.png 795 × 427; 44 KB
-
 GlobalPeakOilForecast-ar.png 600 × 470; 69 KB
-
 GlobalPeakOilForecast.jpg 600 × 432; 130 KB
-
 Hubbert Norway.svg 512 × 384; 24 KB
-
 Hubbert Upper-Bound Peak 1956.png 1,950 × 1,425; 36 KB
-
 Hubbert US high.svg 512 × 384; 30 KB
-
 Hubbert US Lower48.svg 512 × 384; 38 KB
-
 Hubbert világ 2004.jpg 793 × 439; 234 KB
-
 Hubbert world 2004-ar.png 1,000 × 616; 141 KB
-
 Hubbert world 2004.svg 1,066 × 738; 264 KB
-
 HubbertLin Norway.svg 512 × 384; 19 KB
-
 HubbertLin US Lower48.svg 512 × 384; 38 KB
-
 Indice cours petrole brut 1970-1990.png 1,312 × 766; 79 KB
-
 Irak Olieproductie.png 2,654 × 1,709; 209 KB
-
 Iran Oil Production.png 2,200 × 1,700; 30 KB
-
 Libia produzione di petrolio.png 921 × 559; 43 KB
-
-
 March 2012 liquid fuel production.png 978 × 639; 29 KB
-
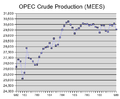 MEESchart.png 432 × 355; 11 KB
-
 Mexican Petroleum Production.PNG 2,200 × 1,700; 27 KB
-
 Mexico Oil Production.png 2,200 × 1,700; 31 KB
-

-
 Montly world petroleum supply 1995-2010 (1-13-2009 data).jpg 643 × 387; 31 KB
-
 ND Oil Production 1905-2012.png 559 × 283; 20 KB
-
 Net Oil Production NorthSee Field contribution.png 1,073 × 744; 62 KB
-
 NorthSeeOil-Nor-NetSaleable-NorthSea.png 1,073 × 744; 50 KB
-
 NorthSeeOil-Nor-NetSaleable-NorthSee and futureDecRates.png 1,074 × 745; 91 KB
-
 Norvege Hubbert.svg 512 × 387; 24 KB
-
 Norway hubbert.jpg 1,201 × 900; 81 KB
-
 Norway hubbert.png 1,201 × 900; 17 KB
-
 Norway Hubbert.svg 512 × 387; 24 KB
-
 NorwayoilproductionandHubbert2013.svg 600 × 480; 13 KB
-
 Norwegischeölproduktionbis2013.png 640 × 480; 31 KB
-
 Oil production August 2013.png 699 × 539; 145 KB
-
 Oil production Norwegian North Sea.PNG 856 × 527; 27 KB
-
 Oil sand production from mining.jpg 911 × 623; 64 KB
-
 Oil-production.png 850 × 518; 27 KB
-
 OilProduction.Iraq1990-2015.png 661 × 386; 30 KB
-
 OilProduction.Libya2010-2015.png 820 × 473; 47 KB
-
 Olajcsúcs grafikon.jpg 803 × 422; 388 KB
-
 Olajkitermeles.jpg 960 × 463; 240 KB
-
 Olfunde.png 931 × 471; 30 KB
-
 Petroleum probabilities.JPG 452 × 297; 23 KB
-
 PrevisionepiccoProduzionePetrolio.svg 814 × 440; 68 KB
-
 Production de pétrole Arabie saoudite États-Unis Russie 2000 2017.png 1,672 × 1,114; 151 KB
-
 Production mondiale de pétrole 1973-2022, selon l'EIA.png 1,516 × 1,030; 609 KB
-
 Production of oil shale-ar.png 525 × 341; 25 KB
-
 Production of oil shale.png 525 × 341; 14 KB
-
 Production of oil shale.svg 1,019 × 566; 322 KB
-
 Production-petrole-2007.png 635 × 709; 24 KB
-
 Production-petrole-prevue.png 600 × 392; 11 KB
-
 Production-petrole-ultra-pr.png 963 × 614; 16 KB
-
 PU200611 Fig1.png 1,258 × 963; 166 KB
-
 Russia Oil Production.png 2,200 × 1,700; 31 KB
-
 Saudi Oil Production.png 2,200 × 1,700; 30 KB
-
 Texas Crude Oil Production.png 719 × 747; 35 KB
-
 Texas Oil Production 1935 to 2005.png 500 × 500; 9 KB
-
 Texas Oil Production 1935-2012.png 2,100 × 1,375; 27 KB
-
 Top 5 oil producing countries.webp 1,164 × 421; 43 KB
-
 Top 5 Oil-Producing Countries.png 2,200 × 1,700; 43 KB
-
 Top Oil Producing Counties-ar.png 701 × 753; 30 KB
-
 Top Oil Producing Countries.png 681 × 741; 28 KB
-
 Trends in top 5 oil-producing countries 1980 to 2013.svg 512 × 341; 17 KB
-

-
 UK oil production-consumption.png 610 × 430; 23 KB
-
 UK Oil Production.png 2,025 × 1,350; 29 KB
-
 Ultimatereserveoilprojections.gif 996 × 715; 46 KB
-
 US Crude Oil Production and Imports.png 668 × 650; 36 KB
-
 US Crude Oil Production and Imports.svg 750 × 540; 22 KB
-
 US Crude Oil Production versus Hubbert Curve.png 632 × 692; 38 KB
-
 US Crude Oil Prodxn, 1920 to 2014-ar.tiff 800 × 295; 47 KB
-
 US Crude Oil Prodxn, 1920 to 2014.tiff 947 × 552; 54 KB
-
 US Oil Forecast 1990-2040.png 578 × 558; 108 KB
-
 Venezuela Oil Production.png 2,200 × 1,700; 29 KB
-
 Weltweite-Erdölproduktion-Grafik.png 1,527 × 816; 295 KB
-
 World crude discovery production U-2200Gb LaherrereMar2015.jpg 875 × 653; 150 KB
-
 World Crude Oil Production.svg 750 × 550; 9 KB
-
 World Oil Production 1960 to 2005.png 500 × 500; 8 KB
-
 World Oil Production 1980-2012.png 2,200 × 1,700; 29 KB
-
 World Oil Production.png 2,000 × 1,350; 28 KB
-
 Yearly oil production in Lithuania (1990 - 2021).png 960 × 537; 43 KB
-
 Ölförderungs-Prognose.svg 814 × 440; 67 KB
-
 Ölproduktion-ausrüstung-saudi-arabien.png 1,749 × 2,453; 189 KB


.png)


.png)


.png)
.jpg)


_(31791566138).png)


.png)

