Category:Media from StemBook
Jump to navigation
Jump to search
Media taken from StemBook
Media in category "Media from StemBook"
The following 169 files are in this category, out of 169 total.
-
 A model for lens repression..jpg 600 × 399; 70 KB
-

-
 A model of endoderm patterning by Wnt and FGF..jpg 432 × 185; 28 KB
-

-
 A model of signalling networks regulating myogenic cell-fate..jpg 600 × 378; 61 KB
-

-
 A protein interaction network in mESCs..jpg 600 × 362; 109 KB
-

-

-
 A three phase model for Müllerian duct development.jpg 180 × 602; 31 KB
-
-
 A-C..jpg 600 × 546; 126 KB
-
 A-E..jpg 600 × 176; 58 KB
-
 An example of hepatoblast delamination..jpg 400 × 189; 54 KB
-
 Analysis of multiple transcription factor occupancy..jpg 445 × 285; 52 KB
-
 Anatomy of the skin de.jpg 491 × 625; 162 KB
-
 Anatomy of the skin.jpg 491 × 625; 152 KB
-

-
 Bile duct formation..jpg 500 × 228; 87 KB
-

-

-

-
 Cellular architecture of the liver..jpg 650 × 343; 108 KB
-
 Characterization of MOVCAR 7 side population cells..jpg 219 × 625; 54 KB
-
 Chemical burn injury..jpg 300 × 226; 56 KB
-
 Commonly used cell lineage marking strategies..jpg 400 × 516; 104 KB
-
 Core transcriptional control of adipogenesis..jpg 600 × 449; 72 KB
-
 Cultured epithelial autograft in burn treatment..jpg 800 × 202; 63 KB
-

-

-
 Development of the respiratory system in mice..jpg 600 × 343; 135 KB
-
 Development of the rodent cornea..jpg 500 × 466; 115 KB
-

-

-

-
 Direct cell labeling..jpg 360 × 220; 28 KB
-

-
 Endoderm derivatives..jpg 351 × 600; 67 KB
-
 Epigenetics of adipose development..jpg 600 × 565; 65 KB
-
 ES cell nuclear architecture..jpg 600 × 207; 55 KB
-
 Examples of reporter gene imaging..jpg 450 × 332; 47 KB
-

-
 Feedback loops of secreted factors induce endoderm..jpg 542 × 600; 82 KB
-
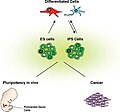 Future avenues in research of pluripotent cells..jpg 500 × 467; 52 KB
-

-
 Genetic links between Notch signaling and c-Kit signaling..jpg 500 × 297; 86 KB
-
 Genome-wide transcription factor location analysis..jpg 416 × 576; 77 KB
-

-
 Hair follicle and inter-follicular epidermis morphogenesis..jpg 500 × 261; 95 KB
-
 Hair follicle StemBook.jpg 226 × 261; 23 KB
-
 Hepatic induction..jpg 400 × 297; 37 KB
-
 Hepatocyte and Biliary epithelium lineage segregation..jpg 500 × 410; 91 KB
-
 Heterochromatin structure in ES cells..jpg 600 × 319; 68 KB
-
 Hhex expression in the ventral foregut endoderm..jpg 300 × 364; 93 KB
-

-
 Histology of important stages of tooth development..jpg 500 × 371; 105 KB
-
 Histology of normal and defective intrahepatic bile ducts..jpg 600 × 245; 151 KB
-

-
 HSC migration from embryonic to fetal hematopoiesis..jpg 600 × 424; 89 KB
-
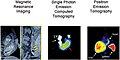
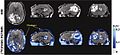 Human stem cell imaging..jpg 576 × 262; 64 KB
-

-
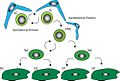 Illustration of stem cell control by the niche..jpg 550 × 369; 78 KB
-
 Imaging after direct cell labeling..jpg 459 × 229; 45 KB
-
 Immunoregulation by regulatory T cells (Treg)..jpg 432 × 311; 46 KB
-
 In vitro hepatic differentiation from ES cells..jpg 500 × 189; 44 KB
-

-
 Intraovarian transplantation of the thecal stem cells..jpg 420 × 600; 114 KB
-

-

-

-
-
 Liver bud growth..jpg 500 × 408; 111 KB
-
 Liver bud morphogenesis..jpg 600 × 268; 93 KB
-
 Liver cell lineage..jpg 350 × 339; 29 KB
-
 Localization of melanocyte stem cells in the hair follicle..jpg 600 × 340; 54 KB
-

-

-
 Location of the intermediate mesoderm nephrogenic cord..jpg 600 × 227; 58 KB
-

-
 LT-HSCs are in the quiescent state..jpg 600 × 580; 87 KB
-
 Metanephric nephron formation..jpg 600 × 155; 49 KB
-
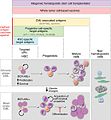
 Methods of nuclear reprogramming, their advantages and limitations..jpg 600 × 536; 156 KB
-

-

-
 MicroRNAs are integral to transcription networks in ESCs..jpg 415 × 287; 50 KB
-

-
 Models for the nature of sustained tumor growth.jpg 675 × 438; 126 KB
-

-
 Myometrial stem cells analyses..jpg 500 × 594; 123 KB
-
 Notch signaling plays a crucial role in melanocyte development..jpg 500 × 210; 58 KB
-

-

-
 Overview of kidney development..jpg 491 × 600; 65 KB
-
 Pancreatic lineages in the mouse..jpg 500 × 471; 58 KB
-
-
 PiRNA pathway is required for germ-cell maintenance in Zebrafish..jpg 500 × 415; 148 KB
-
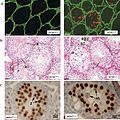 PiRNA pathway is required for spermatogenesis in mouse..jpg 597 × 599; 292 KB
-
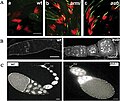 PiRNA pathway mutants show germline defects in Drosophila..jpg 450 × 380; 103 KB
-
 Postmigratory NCSCs.jpg 500 × 500; 84 KB
-

-
-

-
 Relationship between developing islet and duct cells..jpg 206 × 600; 104 KB
-
-

-
 Repressors modulate transcription output..jpg 552 × 346; 51 KB
-

-
 Reprogramming the immune system using ES cells..jpg 360 × 492; 61 KB
-

-
 Schematic cross-section during rodent uterine development..jpg 600 × 555; 123 KB
-
 Schematic depiction of LC-MS MS procedure..jpg 661 × 600; 76 KB
-
 Schematic depiction of two affinity purification approaches..jpg 563 × 600; 93 KB
-
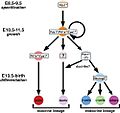
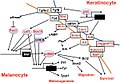
 Schematic drawing of melanocyte development in the mouse..jpg 600 × 507; 88 KB
-
 Schematic overview view of niche components..jpg 350 × 139; 24 KB
-

-

-
 Schematic representation of ovarian embryonic development..jpg 400 × 313; 43 KB
-

-
 Schematic representation of the use of BMSCs as vectors..jpg 700 × 550; 77 KB
-

-

-

-

-
 Sensory placodes and their derivatives..jpg 600 × 383; 84 KB
-
 Sequential soluble factors specify differentiation programs..jpg 381 × 143; 15 KB
-
 Sequential subdivision of the placode territory..jpg 600 × 372; 55 KB
-
-
 Signalling pathways in placode formation..jpg 600 × 486; 66 KB
-
-
 Sources of new adult β-cells..jpg 600 × 329; 86 KB
-
-

-

-
 Structure and signaling mechanisms of the C. elegans GSC niche..jpg 650 × 297; 77 KB
-

-

-

-
 Structure of the mammalian kidney..jpg 600 × 268; 70 KB
-
 Summary of proteomic approaches utilized in the study of stem cells..jpg 600 × 439; 117 KB
-

-
-

-

-

-

-

-
 The Cononical miRNA biogenesis pathway.jpg 600 × 383; 36 KB
-
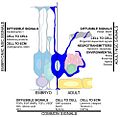
 The embryonic neural stem cell microenvironment.jpg 500 × 708; 139 KB
-
 The endo-siRNA biogenesis pathway.jpg 600 × 402; 54 KB
-
-
 The human cornea in cross-section..jpg 400 × 349; 95 KB
-
 The human limbus..jpg 550 × 394; 109 KB
-
 The Non-canonical miRNA biogenesis pathway.jpg 600 × 447; 43 KB
-
 The primary dental lamina.jpg 600 × 210; 44 KB
-

-
-
 The steps of regenerative medicine..jpg 432 × 430; 55 KB
-
 The transcriptome of pluripotent cells..jpg 444 × 295; 43 KB
-
 The uterus differentiates from the fetal Müllerian ducts..jpg 494 × 477; 76 KB
-
-
 Three phases of GVHD immuno-biology.jpg 450 × 303; 77 KB
-
 Time line of mouse liver development emphazing it.jpg 537 × 187; 60 KB
-
 Time line of mouse liver development..jpg 700 × 319; 96 KB
-
 Transcription factor network in endoderm induction..jpg 424 × 500; 59 KB
-
 Transcription programs in stem cells..jpg 487 × 176; 28 KB
-
-

-
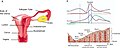 Uterine anatomy..jpg 800 × 320; 82 KB
-
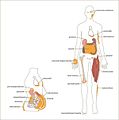 White adipose distribution in the body..jpg 600 × 604; 72 KB


_are_present_throughout_the_mesenchyme_of_the_animal_and_express_category_1_genes..jpg)


_and_mammalian_epithelia_(on_the_right)..jpg)


,_titanium_ECM_composites_(Ti_ECM),_and_titanium_denatured_ECM_compo.jpg)


_in_ES_cells_and_ESC-derived_neuronal_progenitor_cells..jpg)


..jpg)


..jpg)


..jpg)


_and_promising_future_strategies_(C_and_D)_to_stimulate_anti_tumor_immune_responses_(in_orange)..jpg)


,_flow_perfusion_of_0.jpg)


_and_the_subgranular_zone.jpg)


_and_radiographic_(on_the_right)_analysis_of_a_subcutaneous_transplant_of_MSCs_isolated_by_flushing_the_murine_adult_bone_marrow..jpg)
_and_mesenchyme_(blue).jpg)