Category:Maps of El Niño/La Niña effects
Jump to navigation
Jump to search
Effects of El Niño-La Nina-Southern Oscillation. Including animations.
- Try to sort principle theory by “!”, events by date, long term observation by mid of intervall
[[Category:Maps of El Niño/La Niña effects|2004*]]for 2000-2009 - Feel free to do subcategories of sets (as extractions of animatition, to keep them together - sort the main image also in here)
Subcategories
This category has only the following subcategory.
Media in category "Maps of El Niño/La Niña effects"
The following 35 files are in this category, out of 35 total.
-
 El ninjo nordamerika vetero.png 529 × 677; 118 KB
-
 El nino north american weather fr.png 529 × 677; 72 KB
-
 El nino north american weather.png 529 × 677; 64 KB
-
 El Nino regional impacts fr.png 486 × 539; 21 KB
-
 El Nino regional impacts.png 486 × 539; 23 KB
-
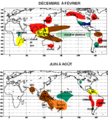
 El Niño global impacts, December to February.jpg 2,100 × 1,292; 460 KB
-
 El Niño global impacts, June to August.jpg 2,100 × 1,292; 456 KB
-
 Enso-index-map.png 918 × 305; 8 KB
-
 La Nina regional impacts fr.png 486 × 539; 21 KB
-
 La Nina regional impacts.gif 486 × 539; 22 KB
-
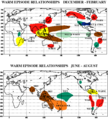
 La Niña global impacts, December to February.jpg 2,100 × 1,292; 464 KB
-
 La Niña global impacts, June to August.jpg 2,100 × 1,292; 453 KB
-
 Mixed layer depth seasonal cycle.png 2,721 × 1,504; 1.91 MB
-
 Movement of surface waters during El Nino.jpg 2,512 × 1,286; 330 KB
-
 Nino.gif 308 × 133; 8 KB
-
 PDO Pattern.png 2,814 × 1,370; 2.23 MB
-
 Comparing Sea Level During El Niño Events (PIA26099).jpg 1,586 × 783; 589 KB
-
 El-Nino-secheresse.pdf 1,370 × 660; 87 KB
-
 El-nino.png 576 × 277; 113 KB
-
 1997 El Nino TOPEX.jpg 2,550 × 2,548; 556 KB
-
 Sst 9798 animated.gif 432 × 282; 876 KB
-
 LaNina Pacific 2006JanFeb.jpg 540 × 465; 109 KB
-
 La Nina and Pacific Decadal Anomalies - April 2008.png 709 × 553; 487 KB
-
 Atmospheric bridge.png 1,256 × 650; 367 KB
-
 CPC-NWS-NOAA SST Anoms 08 JUL 2015.png 500 × 225; 98 KB
-
 El Niño, Dic 1997.png 447 × 281; 65 KB
-
 ENSO effects on Hurricane activity fr.svg 1,242 × 1,299; 124 KB
-
 ENSO effects on Hurricane activity.jpg 1,242 × 1,299; 675 KB
-
 Mean sst equatorial pacific.gif 432 × 645; 24 KB
-
 Niño costero (2016-2017).png 1,590 × 2,006; 169 KB
-
 NOAA-CPC-NWS-NOAA SST Anoms 2015.jpg 920 × 596; 73 KB
-
 Ocean surface temperature averages El Nino 1982-83.gif 825 × 360; 49 KB
-
 Sea Surface Temperature - November 2007.jpg 1,440 × 720; 669 KB
-
 Sstaanim.gif 486 × 234; 113 KB
-
 Sstdailyanom20160101.gif 800 × 510; 101 KB


.jpg)


.png)


