Category:Life expectancy charts by world region
Jump to navigation
Jump to search
Media in category "Life expectancy charts by world region"
The following 51 files are in this category, out of 51 total.
-
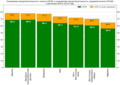 Healthy life expectancy bar chart -WHO regions -ru.png 887 × 627; 51 KB
-
 Healthy life expectancy bar chart -WHO regions -sex -ru.png 887 × 627; 47 KB
-
 Healthy life expectancy bar chart -WHO regions -sex.png 887 × 601; 36 KB
-
 Healthy life expectancy bar chart -WHO regions.png 887 × 601; 42 KB
-
 International-development.gif 347 × 233; 3 KB
-
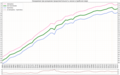
 Lebenserwartung 1950 2005.png 766 × 532; 9 KB
-
 Life expectancy 1950-2005.png 910 × 632; 47 KB
-
 Life Expectancy at Birth 1950-2010.png 1,293 × 743; 88 KB
-
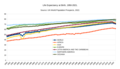 Life Expectancy at Birth 1950-2021.png 2,656 × 1,537; 342 KB
-
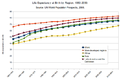 Life Expectancy at Birth by Region 1950-2050.png 728 × 485; 35 KB
-
 Life Expectancy At Birth By Region.png 973 × 534; 69 KB
-
 Life expectancy by world region, from 1770 to 2018.svg 850 × 600; 42 KB
-
 Life expectancy in macroregion -Arab world -diff -ru.png 1,153 × 721; 102 KB
-
 Life expectancy in macroregion -Arab world -diff.png 1,153 × 721; 98 KB
-
 Life expectancy in macroregion -Arab world -ru.png 1,162 × 607; 88 KB
-
 Life expectancy in macroregion -Arab world.png 1,162 × 607; 84 KB
-
 Life expectancy in macroregion -European Union -diff -ru.png 1,153 × 721; 89 KB
-
 Life expectancy in macroregion -European Union -diff.png 1,153 × 721; 84 KB
-
 Life expectancy in macroregion -European Union -ru.png 1,162 × 607; 76 KB
-
 Life expectancy in macroregion -European Union.png 1,162 × 607; 72 KB
-
 Life expectancy in macroregion -income comparison -ru.png 1,386 × 880; 101 KB
-
 Life expectancy in macroregion -income comparison.png 1,386 × 880; 99 KB
-
 Life expectancy in macroregion -income high -diff -ru.png 1,153 × 721; 89 KB
-
 Life expectancy in macroregion -income high -diff.png 1,153 × 721; 83 KB
-
 Life expectancy in macroregion -income high -ru.png 1,162 × 607; 77 KB
-
 Life expectancy in macroregion -income high.png 1,162 × 607; 72 KB
-
 Life expectancy in macroregion -income low -diff -ru.png 1,153 × 721; 105 KB
-
 Life expectancy in macroregion -income low -diff.png 1,153 × 721; 99 KB
-
 Life expectancy in macroregion -income low -ru.png 1,162 × 607; 92 KB
-
 Life expectancy in macroregion -income low.png 1,162 × 607; 87 KB
-
 Life expectancy in macroregion -income middle -diff -ru.png 1,153 × 721; 98 KB
-
 Life expectancy in macroregion -income middle -diff.png 1,153 × 721; 93 KB
-
 Life expectancy in macroregion -income middle -ru.png 1,162 × 607; 87 KB
-
 Life expectancy in macroregion -income middle.png 1,162 × 607; 83 KB
-
 Life expectancy in macroregion -North America -diff -ru.png 1,153 × 721; 90 KB
-
 Life expectancy in macroregion -North America -diff.png 1,153 × 721; 85 KB
-
 Life expectancy in macroregion -North America -ru.png 1,162 × 607; 78 KB
-
 Life expectancy in macroregion -North America.png 1,162 × 607; 73 KB
-
 Life expectancy in macroregion -South Asia -diff -ru.png 1,153 × 865; 109 KB
-
 Life expectancy in macroregion -South Asia -diff.png 1,153 × 865; 105 KB
-
 Life expectancy in macroregion -South Asia -ru.png 1,162 × 743; 97 KB
-
 Life expectancy in macroregion -South Asia.png 1,162 × 743; 93 KB
-
 Life expectancy in macroregion -sub-Saharan Africa -diff -ru.png 1,153 × 721; 101 KB
-
 Life expectancy in macroregion -sub-Saharan Africa -diff.png 1,153 × 721; 96 KB
-
 Life expectancy in macroregion -sub-Saharan Africa -ru.png 1,162 × 607; 87 KB
-
 Life expectancy in macroregion -sub-Saharan Africa.png 1,162 × 607; 83 KB
-
 Life expectancy in macroregion -world -diff -ru.png 1,153 × 721; 93 KB
-
 Life expectancy in macroregion -world -diff.png 1,153 × 721; 89 KB
-
 Life expectancy in macroregion -world -ru.png 1,162 × 607; 82 KB
-
 Life expectancy in macroregion -world.png 1,162 × 607; 78 KB
-
 Lifeexpectancy-region.jpg 605 × 448; 42 KB


