Category:Invalid SVG created with Other tools:Charts
Jump to navigation
Jump to search
Subcategories
This category has the following 3 subcategories, out of 3 total.
Media in category "Invalid SVG created with Other tools:Charts"
The following 22 files are in this category, out of 22 total.
-
 Architecture Overview Android v1.svg 1,443 × 800; 115 KB
-
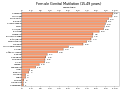
 Total Carbon (TC).svg 948 × 323; 8 KB
-
 Git flow uk.svg 740 × 400; 28 KB
-
 Consiglio regionale TAA 2013.svg 360 × 185; 4 KB
-
 CEC values plot.svg 666 × 351; 38 KB
-
 Checksum.svg 604 × 600; 12 KB
-
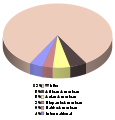 PSURacialMakeup.svg 420 × 440; 7 KB
-
 Biomagnification.svg 512 × 409; 364 KB
-
 Charts SVG Example 14 - Complex Scatter Chart.svg 740 × 401; 10 KB
-
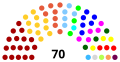
 Composition of the Council of States, India, 2014.svg 320 × 170; 40 KB
-
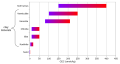
 UK National Minimum Wage to 2015.svg 808 × 436; 79 KB
-
 Cambodiapop.svg 800 × 600; 14 KB
-
 COVID-19 vaccine doses administered by continent.svg 850 × 600; 107 KB
-
 Female Genital Mutilation age 15-49.svg 800 × 600; 100 KB
-
 FGM prevalence 0–14 (2014).svg 800 × 600; 97 KB
-
 FGM prevalence 15–49 (2014).svg 800 × 600; 100 KB
-
 Herd immunity-hy.svg 512 × 628; 154 KB
-
 Japan Photovoltaics Installed Capacity.svg 800 × 600; 8 KB
-
 Life expectancy of Moldova.svg 850 × 600; 32 KB
-
 Timeline of daily COVID-19 vaccine doses administered in the US.svg 850 × 600; 57 KB
-
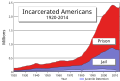 US incarceration timeline-clean.svg 693 × 464; 11 KB
-
 VaccinedosesSoutheastAsia.svg 850 × 600; 61 KB


.svg)
.svg)


.svg)