Category:Interferometric synthetic aperture radar
Jump to navigation
Jump to search
subclass of SAR sensor | |||||
| Upload media | |||||
| Subclass of | |||||
|---|---|---|---|---|---|
| Has use |
| ||||
| |||||
Subcategories
This category has only the following subcategory.
S
Media in category "Interferometric synthetic aperture radar"
The following 58 files are in this category, out of 58 total.
-
 Antarctic Peninsula ice flow ESA360217.jpg 2,855 × 2,561; 2.49 MB
-
 Antarctic Peninsula ice flow ESA360217.tiff 2,855 × 2,561; 4.84 MB
-
 Bay Area displacement ESA369788.jpg 7,718 × 3,333; 15.51 MB
-
 Bay of Naples ESA218751.tiff 5,000 × 5,010; 69.84 MB
-
 Bernese Alps ESA358217.jpg 6,000 × 6,000; 63.8 MB
-
 Bernese Alps ESA358217.tiff 6,000 × 6,000; 123.05 MB
-
 Chile earthquake on the radar ESA347519.jpg 1,613 × 1,292; 1.57 MB
-
 Comparing surface deformation data ESA341141.jpg 3,271 × 2,720; 2.4 MB
-
 Earthquake area in Italy ESA367821.png 1,328 × 616; 1.65 MB
-
 East–west shift ESA368035.jpg 2,076 × 1,329; 4.44 MB
-
 European seismic zones ESA367817.png 956 × 576; 543 KB
-
 Glacier speed West Antarctica ESA373044.jpg 668 × 1,024; 92 KB
-
 Ground Deformation from Chilean Volcanic Eruption Shown by Satellite Radar Image.png 2,881 × 1,729; 13.81 MB
-
 Ground displacement from Italy’s earthquake ESA364416.jpg 3,959 × 2,826; 4.95 MB
-
 Haiti groundmotion comparison by TerraSAR-X.jpg 8,516 × 7,016; 3.83 MB
-
 Hayward fault california.tif 2,135 × 2,386; 10.56 MB
-
 Ice sheet in motion ESA349840.jpg 2,125 × 3,507; 2.26 MB
-

-
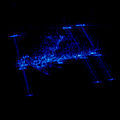 ISS viewed by TerraSAR-X.jpg 1,216 × 1,216; 395 KB
-
 Italy earthquake deformation ESA364415.jpg 4,444 × 4,680; 6.51 MB
-
 Izmit interferogram.jpg 569 × 585; 83 KB
-
 Kathmandu fringes ESA339296.jpg 1,764 × 1,684; 2.8 MB
-
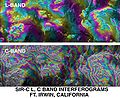 L C band topo interferograms.jpg 638 × 522; 90 KB
-
 Laquila differential interferogram by TerraSAR-X.jpg 1,154 × 1,202; 2.18 MB
-
 Larsen-C crack interferogram ESA376365.jpg 5,000 × 4,368; 8.65 MB
-
 Lost Hills Subsidence interferogram.jpg 504 × 662; 88 KB
-
 Mapping Italy’s 30 October 2016 earthquake ESA367957.jpg 4,008 × 2,264; 13.18 MB
-
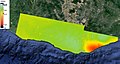
 Mauna Loa Summit Inflation InSAR.jpg 404 × 410; 69 KB
-
 Moosfluh slope instability ESA372872.jpg 4,955 × 3,511; 4.29 MB
-
 NASA Hectormine Earthquake Interferogram.jpg 288 × 222; 25 KB
-
 NASA InSAR satellite measuring earthquakes.jpg 640 × 360; 70 KB
-
 NASA Kilauea InSAR.jpg 1,511 × 863; 401 KB
-
 Oaxaca interferogram ESA22145314 (ascending).jpeg 2,767 × 1,473; 4.27 MB
-
 Oaxaca interferogram ESA22145314 (descending).jpeg 2,769 × 1,651; 4.38 MB
-
 Oaxaca interferogram ESA22145314.jpeg 2,834 × 3,228; 8.21 MB
-
 Oslo train station on the move ESA369789.jpg 1,475 × 1,045; 1.01 MB
-
 Paired Sentinel-1 interferogram ESA362276.jpg 1,797 × 5,000; 1.8 MB
-
 San Francisco displacement ESA369787.jpg 1,899 × 948; 1.06 MB
-
 SAR Kilauea topo interferogram.jpg 577 × 577; 152 KB
-
 Sentinel-1A and -1B combined ESA362263.jpg 602 × 517; 192 KB
-
 Sentinel-1A and -1B radar scans combined ESA362265.jpg 1,379 × 1,575; 1.28 MB
-
 Siles dam subsidence ESA370928.jpg 2,928 × 1,647; 1.68 MB
-
 Source fault of Italy’s earthquake ESA364418.jpg 1,378 × 1,111; 691 KB
-
 Spotting geohazards with Sentinel-1 ESA360321.png 1,883 × 987; 2.32 MB
-
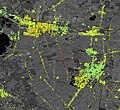
 Ssis InSAR may2001.jpg 1,081 × 878; 197 KB
-
 Staufen interferogram detailed by TerraSAR-X.jpg 400 × 400; 171 KB
-
 Subsidence from salt mining ESA361220.jpg 858 × 789; 275 KB
-
 Subsidence in Denmark ESA361236.jpg 1,828 × 1,122; 628 KB
-
 Surface deformation ESA22145355 (ascending).jpeg 2,754 × 1,473; 3.03 MB
-
 Surface deformation ESA22145355 (descending).jpeg 2,770 × 1,655; 2.3 MB
-
 Surface deformation ESA22145355.jpeg 2,834 × 3,228; 4.95 MB
-
 Surface deformation from Kumamoto earthquake ESA360322.png 1,518 × 1,200; 1.17 MB
-
 Tracking every move ESA361218.jpg 2,804 × 1,280; 1.48 MB
-
 Türkiye–Syria interferogram ESA24711647.jpeg 1,920 × 1,440; 4.69 MB
-
 Vertical displacement ESA368036.jpg 2,074 × 1,330; 4.65 MB
-
 Vulnerable shores ESA361223.jpg 1,097 × 582; 142 KB
-
 Zachariae glacier ESA359964.jpg 1,920 × 1,874; 6.43 MB
-
 Zachariae glacier ESA359964.tiff 5,119 × 4,996; 84.92 MB


.jpeg)
.jpeg)


.jpeg)
.jpeg)


