Category:Graphs for inductors
Jump to navigation
Jump to search
Media in category "Graphs for inductors"
The following 32 files are in this category, out of 32 total.
-
 Auf- und Entladung Spule.png 1,024 × 572; 11 KB
-
 Auto-induction - i fonction de t.png 306 × 196; 7 KB
-
 Balayage entrelace signal bobines 1 periode.png 1,024 × 684; 8 KB
-
 Balayage entrelace signal bobines debut.png 1,024 × 684; 8 KB
-
 Balayage entrelace signal bobines fin.png 1,024 × 684; 9 KB
-
 Boost resistance.png 1,500 × 1,050; 73 KB
-
 Boost resistance.svg 950 × 700; 20 KB
-
 Buck resistance french.png 1,500 × 1,050; 65 KB
-
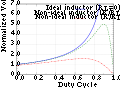
 Buck resistance.png 1,500 × 1,050; 76 KB
-
 Buckboost resistance fr.png 1,500 × 1,050; 64 KB
-
 Buckboost resistance-ru.svg 737 × 595; 3 KB
-
 Buckboost resistance.png 1,500 × 1,050; 76 KB
-
 Buckboost resistance.svg 600 × 480; 17 KB
-
 Catchdiode.jpg 690 × 547; 29 KB
-
 Coil explaining.jpg 665 × 410; 87 KB
-
 Coil saturation.PNG 362 × 314; 9 KB
-
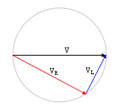 DiagFresnel1.png 193 × 178; 5 KB
-
 Hanna curve by Zureks.svg 320 × 195; 9 KB
-
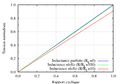
 Impedance bobine parfaite.png 804 × 566; 15 KB
-
 InductA.png 351 × 364; 5 KB
-
 InductA.svg 400 × 400; 9 KB
-
 InductB.png 351 × 364; 6 KB
-
 InductB.svg 400 × 400; 10 KB
-
 Inductor switch-on-off positive voltage.png 600 × 550; 36 KB
-
 Inductor switch-on-off.svg 600 × 550; 117 KB
-
 Inductor switch-on.svg 600 × 310; 58 KB
-
 Lamepoolid.png 1,036 × 435; 72 KB
-
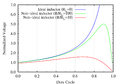
 Resistance and reactance of real inductor.png 626 × 428; 27 KB
-
 Steinmetzformel error factor.jpg 1,189 × 856; 68 KB
-
 Temp of a winding.PNG 598 × 581; 9 KB
-
 Waveforms - inductive reactance.svg 800 × 500; 23 KB
-
 Zeitkonstante.jpg 3,256 × 1,949; 1.16 MB


