Category:Gender pay gap statistics
Jump to navigation
Jump to search
Media in category "Gender pay gap statistics"
The following 66 files are in this category, out of 66 total.
-
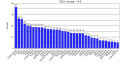
 % DE DIFFERENCE DE SALAIRE ENTRE HOMME ET FEMME.jpg 597 × 290; 29 KB
-
 Average earnings of workers by education and sex - 2006.png 963 × 721; 57 KB
-

-
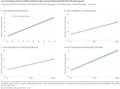
 Decomposition of the gender wage gap, 1, OWID.svg 850 × 600; 8 KB
-
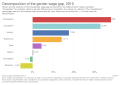 Decomposition of the gender wage gap, OWID.svg 850 × 600; 8 KB
-

-
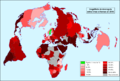
 Equal remuneration convention.svg 863 × 443; 1.54 MB
-
 EU 27 Gender Pay Gap 2008.png 1,280 × 720; 109 KB
-
 EU 27 Gender Pay Gap 2009.png 1,280 × 720; 26 KB
-
 EU 27 Gender Pay Gap 2010.png 1,280 × 720; 27 KB
-
 EU 27 Gender Pay Gap 2011.png 1,280 × 720; 27 KB
-
 EU 27 Gender Pay Gap 2012.png 1,280 × 720; 26 KB
-
 EU 27 Gender Pay Gap 2013.png 1,280 × 720; 26 KB
-
 EU 27 Gender Pay Gap 2014.png 1,280 × 720; 50 KB
-

-

-

-
 Gender gap in average wages, 2000 vs 2015, OWID.svg 850 × 600; 13 KB
-
-
 Gender pay gap across EU countries.png 982 × 597; 55 KB
-
 Gender pay gap by state.png 1,000 × 618; 177 KB
-
 Gender Pay Gap Hungary EU27.svg 512 × 284; 13 KB
-
 Gender Pay Gap Irland 2008-2014 Eurostat.svg 512 × 284; 11 KB
-
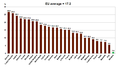
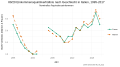
 Gender Pay Gap NACE2 IT EU27 2007-2017 EUSILC.svg 512 × 284; 17 KB
-
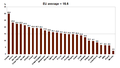
 Gender Pay Gap NACE2 NL EU27 2007-2017 EUSILC.svg 512 × 284; 15 KB
-
 Gender Pay Gap Vereinigtes Königreich 2008-2014 Eurostat.svg 512 × 284; 10 KB
-
 Gender pay gap österreich.svg 512 × 284; 13 KB
-
 Gender Paygap FR 2007-2017 EUROSTAT.svg 512 × 284; 9 KB
-
 Gender wage gap across the years in U.S.png 565 × 249; 59 KB
-
 Gender Wage Gap in Australia.png 450 × 339; 29 KB
-
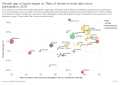
 Gender wage gap vs GDP per capita, 1, OWID.svg 850 × 600; 15 KB
-
 Gender wage gap vs GDP per capita, OWID.svg 850 × 600; 15 KB
-
 Gender wage gap.svg 1,080 × 720; 109 KB
-

-
 Genderincome Share HR EU 2010-2017 EUSILC.svg 512 × 284; 15 KB
-
 Genderincome Share PL EU 2010-2017 EUSILC.svg 512 × 284; 19 KB
-
 Genderpaygap HR EUSILC.svg 512 × 284; 10 KB
-
 Genderpaygap PL EU SILC.svg 512 × 284; 10 KB
-
 Genderpaygapsector HR EUSILC.svg 512 × 284; 31 KB
-
 Hourly Earnings.png 1,530 × 974; 246 KB
-
 Income distribution in Japan by sex.svg 1,200 × 750; 22 KB
-
 Income inequity US.png 505 × 307; 9 KB
-
 Inegalitats salarialas entre òmes et fremas en 2016.png 1,707 × 1,148; 373 KB
-
 OECD Gender Pay Gap 2008.png 1,280 × 720; 280 KB
-
 OECD gender wage gap 2006.jpeg 526 × 528; 90 KB
-
 OECD gender wage gap.svg 1,280 × 720; 46 KB
-
 Ratio of Women's Earnings to Men's by Age 2012.png 1,617 × 1,021; 33 KB
-
 S80 S20 Ratio by Sex IT 1995-2017 EUSILC.svg 512 × 284; 16 KB
-
 S80 S20 Ratio by Sex NL 1995-2017 EUSILC.svg 512 × 284; 15 KB
-
 The gender wage ratio in different income percentiles, OWID.svg 850 × 600; 6 KB
-
 Unadjusted gender gap in average hourly wages, OWID.svg 850 × 600; 7 KB
-
 Unadjusted gender gap in median earnings, OWID.svg 850 × 600; 17 KB
-
 Unadjusted gender wage gap including unemployed, OWID.svg 850 × 600; 7 KB
-
 United States median income by education and sex full time 25-64.svg 1,200 × 750; 5 KB
-
 US Gender Pay Gap by industry .001.png 1,280 × 720; 376 KB
-
 US gender pay gap by state.svg 959 × 593; 32 KB
-
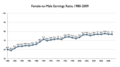 US Gender pay gap, 1980-2009.001.png 1,280 × 720; 98 KB
-
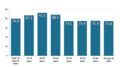 US Gender pay gap, by age.001.png 1,280 × 720; 248 KB
-
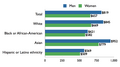
 US Gender pay gap, by race and ethnicity.001.png 1,280 × 720; 253 KB
-
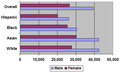
 US gender pay gap, by sex, race-ethnicity-2009 EL.jpg 1,281 × 720; 127 KB
-
 US gender pay gap, by sex, race-ethnicity-2009.png 1,280 × 720; 54 KB
-
 US Gender pay gap, by state.png 2,000 × 1,237; 416 KB
-
 US womens earnings as a percentage of mens 1979-2005.gif 401 × 238; 4 KB
-

-
-
 Àmbit 2 Palau Robert Jugo com una nena.jpg 4,032 × 3,024; 1.59 MB


.png)
.png)


.png)

