Category:Food diagrams
Jump to navigation
Jump to search
pseudoscientific nutritional approach that advocates/discourages specific combinations of foods  | |||||
| Upload media | |||||
| |||||
Subcategories
This category has the following 3 subcategories, out of 3 total.
Media in category "Food diagrams"
The following 56 files are in this category, out of 56 total.
-
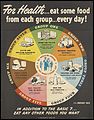
 "For Health - Eat Some Food from Each Group Every day" - NARA - 514287.jpg 2,298 × 3,000; 1.05 MB
-
 "For Health...eat some food from each group...every day" - NARA - 514288.jpg 2,318 × 3,000; 860 KB
-
 20111110-OC-AMW-0003 - Flickr - USDAgov.jpg 2,696 × 2,087; 1.54 MB
-
 20111110-OC-AMW-0012 - Flickr - USDAgov.jpg 2,195 × 2,759; 1.35 MB
-
 Bean Nutrition.png 1,220 × 909; 65 KB
-
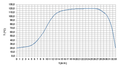
 Cereal Self-sufficiency ratio.png 754 × 565; 51 KB
-
 Die Frau als Hausärztin (1911) 042 Zusammensetzung der Lebensmittel.png 592 × 851; 452 KB
-
 Eatwell Plate.png 2,000 × 2,279; 267 KB
-
 FAO kcal his JA.png 754 × 565; 61 KB
-
 FAO kcal his.png 625 × 433; 52 KB
-
 Food Self-sufficiency ratio (English).png 755 × 564; 57 KB
-
 Food Self-sufficiency ratio.png 755 × 564; 50 KB
-
 For health Wellcome L0063793.jpg 4,816 × 6,128; 6.68 MB
-
 FreeRiceDonations.PNG 527 × 345; 12 KB
-
 Fruit Nutrition (fa).jpg 1,291 × 968; 105 KB
-
 Fruit Nutrition.png 1,291 × 968; 103 KB
-
 Gráfica de la GAPA.jpg 1,280 × 905; 110 KB
-
 Guide to Healthy Eating 2013.jpg 1,073 × 686; 229 KB
-
 Health effects of cheese.png 1,500 × 1,085; 581 KB
-
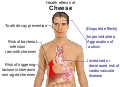 Health effects of cheese.svg 1,500 × 1,085; 850 KB
-
 Healthy Eating Guide.png 709 × 519; 158 KB
-
 Healthy Eating Tool for Adults.jpg 789 × 492; 120 KB
-
 Infographics - Gajar ka halwa-Carrot sweet dish.jpg 1,872 × 7,016; 3.74 MB
-
 JA Food Sec 1965 2005.png 1,320 × 1,020; 112 KB
-
 JA Food Sec 1965 2010.png 1,512 × 1,134; 124 KB
-
 Jhon40.jpg 117 × 129; 5 KB
-
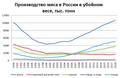 MyasoRF.png 564 × 366; 16 KB
-
 Nutrisls.jpg 720 × 540; 28 KB
-
 PENETRAZ CALORE1.png 500 × 281; 53 KB
-
 Pieno sudėtis.jpg 4,961 × 2,362; 863 KB
-
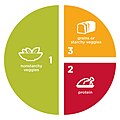 Plate v1.jpg 1,000 × 1,000; 68 KB
-
 Plate v2.jpg 1,000 × 1,000; 68 KB
-
 Plate v3.jpg 1,000 × 1,000; 69 KB
-
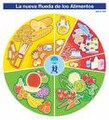
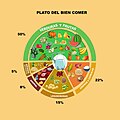 Plato del bien comer.jpg 1,128 × 1,128; 121 KB
-
 Producenci Kakao.jpg 721 × 421; 28 KB
-
 Proporti alimente.jpg 378 × 310; 42 KB
-
 Quellen täglicher Energiezufuhr in % 2001-2003 (FAO).svg 711 × 532; 44 KB
-
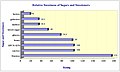 Relativesweetness.jpg 1,228 × 733; 280 KB
-
 Relativesweetness.svg 512 × 330; 10 KB
-
 Roda dos Alimentos.jpg 250 × 250; 24 KB
-

-
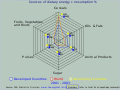 Sources of dietary energy-consumtion (%) 2001-2003 (FAO).svg 711 × 532; 33 KB
-
 СКОР горохового белка.png 902 × 778; 42 KB
-
 СКОР овсяного белка.png 901 × 778; 41 KB
-
 Statistik küchenkräuter und gewürzpflanzen 2007-2013.png 712 × 395; 40 KB
-
 Steinmetzverfahren.jpg 732 × 415; 76 KB
-
 StoriaDieta.png 902 × 935; 216 KB
-
 Système alimentaire.png 1,387 × 751; 628 KB
-
 Tallriksmodellen.jpg 1,000 × 1,000; 145 KB
-
 The Basic 7.png 1,537 × 1,781; 3.59 MB
-
 The Food Wheel - A Pattern for Daily Food Choices.png 833 × 1,036; 1.28 MB
-
 The Hassle Free Daily Food Guide.png 1,095 × 1,620; 2.03 MB
-
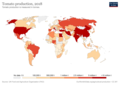 Tomato-production.png 3,400 × 2,400; 748 KB
-
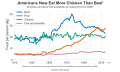 US Consumption of Meat, Poultry, and Fish.svg 900 × 540; 75 KB
-
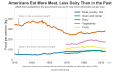 US Food Consumption Over Time.svg 900 × 540; 82 KB
-
 USDA - Basic 7 Food Groups.jpg 1,024 × 1,293; 150 KB


_042_Zusammensetzung_der_Lebensmittel.png)


.png)


.jpg)


.svg)


_2001-2003_(FAO)(Simplified).svg)
_2001-2003_(FAO).svg)


