Category:Election apportionment diagrams of the European Parliament (2004-2009)
Jump to navigation
Jump to search
Media in category "Election apportionment diagrams of the European Parliament (2004-2009)"
The following 15 files are in this category, out of 15 total.
-
 2004 European Parliament.svg 360 × 185; 43 KB
-
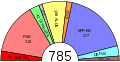
 Composition of the European Parliament.svg 195 × 179; 9 KB
-
 Eleccionseuropees2004.PNG 464 × 287; 6 KB
-
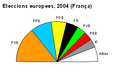 Euroelec04frca.PNG 337 × 205; 5 KB
-
 European Parliament 6th term (2007).svg 330 × 170; 11 KB
-
 European Parliament 6th term new.png 250 × 140; 11 KB
-
 European Parliament 6th term.png 250 × 140; 10 KB
-
 European Parliament 6th term.svg 800 × 448; 3 KB
-
 European Parliament composition by political groups election 2004.svg 320 × 220; 523 KB
-
 European Parliament composition by political groups election 2007.svg 320 × 220; 557 KB
-
 European Parliament political groups 19 February 2007.svg 300 × 150; 11 KB
-
 PE2004e.png 977 × 497; 17 KB
-
 PE2004e.svg 756 × 584; 6 KB
-
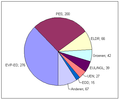
 Pie chart EP election 2004.svg 744 × 574; 8 KB
-
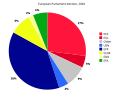
 Zetelverdeling.png 468 × 389; 11 KB


.svg)


