Category:Economic charts of the Republic of Ireland
Jump to navigation
Jump to search
Countries of Europe: Austria · Bulgaria · Czech Republic · Finland · France‡ · Germany · Greece · Hungary · Republic of Ireland · Portugal‡ · Romania · Russia‡ · Switzerland · Ukraine · United Kingdom
‡: partly located in Europe
‡: partly located in Europe
Media in category "Economic charts of the Republic of Ireland"
The following 47 files are in this category, out of 47 total.
-
 2011 Ratio of GNI to GDP (EuroStat National Accounts).png 300 × 480; 58 KB
-
 At-risk-of-poverty rate ireland 1995-2016.svg 512 × 293; 12 KB
-
 Average tax wedge for single worker (OECD vs Ireland, 2000 to 2017).png 1,284 × 413; 46 KB
-
 BruttostaatsschuldenEuro.png 958 × 593; 29 KB
-
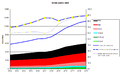 BruttostaatsschuldenEuroEngl.png 958 × 593; 30 KB
-
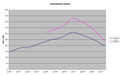
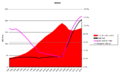
 Celtictiger 1.gif 495 × 345; 18 KB
-
 Disposable Income Per Person 2018 (Ireland).png 1,495 × 1,104; 245 KB
-
 Distribution of Irish Exchequer Tax (2000 to 2017).png 872 × 540; 37 KB
-
 Distribution of Wealth in Ireland.svg 800 × 600; 24 KB
-
 Dublin Office cost of build versus EU-28 (2016).jpg 638 × 479; 59 KB
-
 Dublin Office sales price versus EU-28 (2016).jpg 638 × 479; 65 KB
-

-
 Effective employment tax (Ireland vs OECD average, 2017).png 1,452 × 425; 112 KB
-
-

-
 Gini index ireland 1995-2016.svg 512 × 293; 12 KB
-
 Impact of Ireland Corporation Tax Regime on Ireland's Economy.jpg 742 × 563; 61 KB
-

-
 Income percentiles ireland - relative change - 1995-2016.svg 512 × 293; 15 KB
-
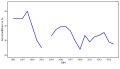
 Interest rates Ireland 1993-2018.svg 475 × 332; 11 KB
-
 Ireland Balance of Payment Components (2012-2017).png 680 × 490; 217 KB
-
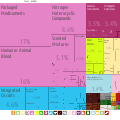
 Ireland Export Treemap.jpg 2,668 × 2,085; 1.91 MB
-
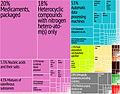
 Ireland Exports Treemap 2017.svg 900 × 900; 508 KB
-
 Ireland GDP per capita.png 663 × 334; 15 KB
-
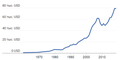
 Ireland GDP.webp 1,588 × 388; 31 KB
-
 Ireland house prices.png 970 × 604; 19 KB
-
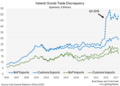 Ireland Trade Good Discrepancy (1995-2017).png 680 × 489; 326 KB
-
 Irish Corporation Tax (% of GDP and % of Total Tax).png 588 × 517; 27 KB
-
 Irish Corporation Tax as % of Total Irish Tax (1989 to 2012).pdf 1,239 × 1,752; 1.26 MB
-
 Irish Corporation Tax as % of Total Tax (1989 to 2012).jpg 1,843 × 1,303; 244 KB
-
 Irish Corporation Tax Rates (1974 to 2016).png 600 × 499; 42 KB
-
 Irish debt and EU average.png 704 × 681; 51 KB
-
 Irish Debt to GDP and GNI (2000 to 2017).png 852 × 536; 25 KB
-
 Irish Exchequer Tax Revenues to GDP and GNI.png 864 × 491; 24 KB
-
 Irish Exports 2014.svg 750 × 520; 50 KB
-
 Irish GDPDebt Ratio Chart.jpg 500 × 360; 56 KB
-
 Irish house prices Central Statistics Office.png 970 × 604; 19 KB
-
 Irish Personal Tax System - OECD Progressivity Ratio (2015).png 960 × 521; 110 KB
-
 Irishcorporatetaxrate.PNG 469 × 401; 24 KB
-
 IrlSchuKrise.png 960 × 594; 37 KB
-
 IrlSchuKriseEngl-ar.png 960 × 594; 58 KB
-
 IrlSchuKriseEngl.png 960 × 594; 36 KB
-
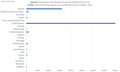
 OECD 2018 Corporate Tax Rates.png 607 × 764; 47 KB
-
 OECD Public Debt per Capita (2015).png 848 × 372; 27 KB
-
 S80s20 ireland 2005-2016.svg 512 × 293; 11 KB
-
 Tax-to-GDP Ratio (Ireand versus OECD, 2000-2016).png 1,448 × 541; 54 KB
-
 ديون ايرلندا منذ 1999.jpg 704 × 681; 74 KB
.png)


.png)
.png)

.jpg)
.jpg)
.jpg)


.png)


.png)
.png)
.jpg)
.png)

.png)


.png)


.png)


.png)
.png)
.png)