Category:Demographic charts of France
Jump to navigation
Jump to search

Subcategories
This category has the following 7 subcategories, out of 7 total.
Media in category "Demographic charts of France"
The following 95 files are in this category, out of 95 total.
-
 Demography Achenheim.svg 1,240 × 660; 5 KB
-
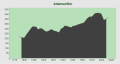 Demography Adamswiller.svg 1,240 × 660; 5 KB
-
 Demography Allenwiller.svg 1,240 × 660; 6 KB
-
 Demography Alteckendorf.svg 1,240 × 660; 5 KB
-
 Demography Altenheim.svg 1,240 × 660; 5 KB
-
 Demography Altorf.svg 1,240 × 660; 5 KB
-
 Demography Altwiller.svg 512 × 273; 4 KB
-
 Demography Ansacq.svg 1,240 × 660; 5 KB
-
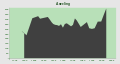 Demography Anzeling.svg 1,240 × 660; 5 KB
-
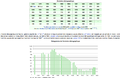
 Aquitaine etranger immigres.jpg 2,756 × 1,654; 322 KB
-
 Évolut°populat°Aucey la Plaine.jpg 600 × 600; 49 KB
-
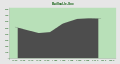 Demography Bailleul-le-Soc.svg 1,240 × 660; 5 KB
-
 BirthDeath 1950 FR.svg 480 × 280; 8 KB
-
 Demography Boesenbiesen.svg 1,240 × 660; 5 KB
-
 Canton-Mouthoumet (France) Demo.jpg 701 × 399; 211 KB
-
 Canton-Mouthoumet demo.png 883 × 431; 27 KB
-
 Carhaix-Plouguer demographics.png 722 × 360; 10 KB
-
 Demography Chateauneuf-Miravail.svg 1,240 × 660; 6 KB
-
 Demography Chavagnac.svg 1,240 × 660; 5 KB
-
 Couzon - Logement.jpg 521 × 567; 21 KB
-
 Couzon - Nombre de véhicules par foyer.jpg 513 × 561; 19 KB
-
 Couzon - Occupation des logements.jpg 526 × 574; 21 KB
-
 Couzon - Population.jpg 569 × 559; 23 KB
-
 Couzon - Taille des logements.jpg 575 × 563; 23 KB
-
 Crescita demografica Francia.jpg 660 × 383; 31 KB
-
 Démographie Avanne-Aveney.jpg 600 × 600; 48 KB
-
 Démographie de la commune de Monteplain 1793–2006.png 400 × 150; 9 KB
-
 Empact2005.png 504 × 236; 6 KB
-
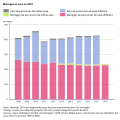
 Evolution mariages PACS France INSEE.png 729 × 451; 73 KB
-
 Evolution population Echenevex.png 1,007 × 674; 8 KB
-
 France nombre de centenaires 1999-2010.png 546 × 780; 31 KB
-
 France population 1831.png 447 × 260; 5 KB
-
 Graphique - Démographie de Thouaré-sur-Loire.jpg 600 × 358; 117 KB
-
-
 Graphique population londe les maures.jpg 715 × 529; 52 KB
-
 Guadeloupe demography.png 724 × 426; 18 KB
-
 Demography Heilles.svg 1,240 × 660; 5 KB
-
 HistoirePopulationFr.jpg 684 × 456; 39 KB
-
 Demography Hommert.svg 1,240 × 660; 5 KB
-
 Demography Hondainville.svg 1,240 × 660; 5 KB
-
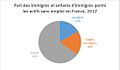 ImmigActSansEmp2012.jpg 534 × 313; 25 KB
-
 Immigres franche comte 1999.png 2,429 × 1,177; 47 KB
-
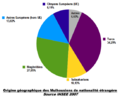 Immigrés mulhouse.png 550 × 450; 106 KB
-
 L'Abergement-Clémenciat, France Population.jpg 600 × 463; 29 KB
-
 Demography Lamarche.svg 1,240 × 660; 5 KB
-
 Logo-ecarts-identité.png 386 × 65; 7 KB
-
 Demography Maisse.svg 1,240 × 660; 5 KB
-
 Mariages et pacs de 2007 à 2017.svg 600 × 600; 10 KB
-
 Mariages et pacs de 2008 à 2018.svg 600 × 600; 11 KB
-
 Mariages à Querrieu, période révolutionnaire.JPG 1,035 × 691; 49 KB
-
 Martinique demography.png 724 × 426; 18 KB
-
 Demography Matzenheim.svg 1,240 × 660; 5 KB
-
 Demography Mittelschaeffolsheim.svg 1,240 × 660; 6 KB
-
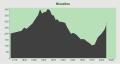
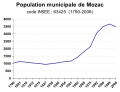 Mozac population.svg 482 × 369; 89 KB
-
 Population de Mozac améliorée.jpg 615 × 388; 74 KB
-
 Naissances & avortements (France).png 393 × 321; 8 KB
-
 Naissances depuis 1900 en France.GIF 638 × 418; 8 KB
-
 Naissances et avortements en France - version légendée en russe.png 792 × 644; 62 KB
-
 Naissances hors mariage.PNG 937 × 489; 35 KB
-
 Naissances ou avortement (France).png 481 × 391; 3 KB
-
 Demography Neau.svg 1,240 × 660; 5 KB
-
 Demography Neuilly-sous-Clermont.svg 1,240 × 660; 5 KB
-
 New Caledonia demography.png 724 × 426; 20 KB
-
 Demography Niozelles.svg 1,240 × 660; 5 KB
-
 Origine immigres Franche Comte 1999.png 1,465 × 1,069; 58 KB
-
 Ouvact2005.gif 545 × 290; 7 KB
-
 Part des naissances de mères nées hors d'Europe ex Urss.JPG 988 × 655; 92 KB
-
 Part des naissances de parents nés à l’étranger 1998-2013.JPG 986 × 646; 51 KB
-
 Pop Ardennes.jpg 1,276 × 771; 164 KB
-
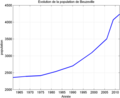 Pop beuzeville.png 489 × 398; 21 KB
-
 Popact2005.gif 573 × 270; 10 KB
-
 PopBux.JPG 597 × 328; 24 KB
-
 Population age TYPE.png 627 × 418; 21 KB
-
 Population d'auxange au fil du temps.jpg 1,156 × 490; 95 KB
-
 Population de Cannes-Ecluse par lieu de travail.jpg 610 × 528; 30 KB
-
 Population de Querrieu de 1700 à 2006.JPG 885 × 335; 66 KB
-
 Population Dombasle-sur-Meurthe.svg 655 × 240; 44 KB
-
 Population du canton de Villers-Bocage.JPG 1,034 × 653; 122 KB
-
 Population Saint-Genis-Pouilly 03.jpg 672 × 344; 43 KB
-
 PSM V70 D575 Population increase of the usa compared to major european states.png 1,660 × 2,327; 186 KB
-
 Pyramide Sainte Foy l'Argentière 1999 F.png 300 × 504; 6 KB
-
 Pyramide Sainte Foy l'Argentière 1999 M.png 300 × 504; 5 KB
-
 Demography La Ravoire.svg 1,240 × 660; 5 KB
-
 RNI 1950 FR.svg 480 × 264; 7 KB
-
 Demography Rozay-en-Brie.svg 1,240 × 660; 6 KB
-
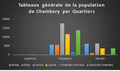 Répartion de la population par quartier à Chambéry.png 491 × 289; 58 KB
-
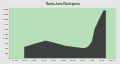
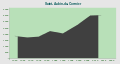 Demography Saint-Aubin-du-Cormier.svg 1,240 × 660; 5 KB
-
 Demography SaintJustChaleyssin.svg 512 × 273; 4 KB
-
 Solde naturel france avec mayotte à partir 2014.png 1,167 × 787; 198 KB
-
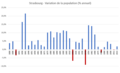 Strasbourg - Variation de la population.png 729 × 442; 20 KB
-
 Tasa de participación de las mujeres y de los hombres en Francia.PNG 427 × 475; 10 KB
-

-
 Demography Valencin.svg 512 × 273; 4 KB
-
 Demography Vesoul.svg 1,240 × 660; 5 KB
-
 Demography Witternheim.svg 1,240 × 660; 6 KB


_Demo.jpg)


.png)


.png)


