Category:Death maps of the world
Jump to navigation
Jump to search
Subcategories
This category has the following 8 subcategories, out of 8 total.
*
D
- Death penalty maps of the world (28 F)
H
- Homicide rate maps of the world (14 F)
L
S
- Suicide rate world maps (53 F)
Media in category "Death maps of the world"
The following 148 files are in this category, out of 148 total.
-

-
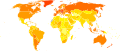
 Air pollution death rates.png 1,080 × 556; 292 KB
-
 AntimcrresUKreview1.jpg 1,455 × 2,006; 208 KB
-
 Bladder cancer world map - Death - WHO2004.svg 940 × 415; 1.45 MB
-
 Breast cancer world map - Death - WHO2004.svg 940 × 415; 1.45 MB
-
 Cancer-death-rates.jpg 3,400 × 2,400; 242 KB
-
 Cardiovascular-disease-death-rates.png 3,400 × 2,400; 737 KB
-
 Cervix uteri cancer world map - Death - WHO2004.svg 940 × 415; 1.45 MB
-
 Colon and rectum cancers world map - Death - WHO2004.svg 940 × 415; 1.45 MB
-
 Colon and rectum cancers world map - Death - WHO2004small.png 620 × 286; 72 KB
-
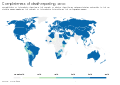 Completeness of death reporting, OWID.svg 850 × 600; 140 KB
-
 Corpus uteri cancer world map - Death - WHO2004.svg 940 × 415; 1.45 MB
-
-
 Daily-smoking-prevalence-bounds.png 3,103 × 1,852; 495 KB
-
 Daily-smoking-prevalence-bounds.svg 850 × 600; 161 KB
-
 Death rate attributed to an unsafe water source, OWID.svg 850 × 600; 140 KB
-
 Death rate from Alzheimer and other dementia, OWID.svg 850 × 600; 141 KB
-
 Death rate from ambient particulate air pollution, OWID.svg 850 × 600; 142 KB
-
 Death rate from amphetamine overdoses, OWID.svg 850 × 600; 141 KB
-
 Death rate from cardiovascular disease, OWID.svg 850 × 600; 141 KB
-
 Death rate from drowning, OWID.svg 850 × 600; 141 KB
-
 Death rate from fires and burns, OWID.svg 850 × 600; 141 KB
-
 Death rate from malnutrition, OWID.svg 850 × 600; 141 KB
-
 Death rate from natural disasters, OWID.svg 850 × 600; 141 KB
-
 Death rate from obesity, OWID.svg 850 × 600; 141 KB
-
 Death rate from opioid overdoses, OWID-IT.svg 850 × 600; 150 KB
-
 Death rate from opioid overdoses, OWID.svg 850 × 600; 141 KB
-
 Death rate from road accidents, OWID (2017).svg 850 × 600; 142 KB
-
 Death rate from road accidents, OWID (2019).svg 850 × 600; 168 KB
-
 Death rate from suicides (IHME (1990 to 2016)), OWID.svg 850 × 600; 141 KB
-
 Death rate from unintentional poisoning, OWID.svg 850 × 600; 141 KB
-
 Death rate from unsafe sanitation, OWID.svg 850 × 600; 141 KB
-
 Death rate from venomous animal contact, OWID.svg 850 × 600; 140 KB
-
 Death rate world map CIA 2009.PNG 1,455 × 630; 41 KB
-
 Death rates from air pollution, 2, OWID.svg 850 × 600; 140 KB
-
 Death rates from alcohol and drug use disorders, OWID.svg 850 × 600; 141 KB
-
 Death rates from alcohol use disorders, OWID.svg 850 × 600; 142 KB
-
 Death rates from cocaine overdoses, OWID.svg 850 × 600; 141 KB
-
 Death rates from conflict and terrorism, OWID.svg 850 × 600; 141 KB
-
 Death rates from drug use disorders, OWID.svg 850 × 600; 141 KB
-
 Death rates from eating disorders, OWID.svg 850 × 600; 140 KB
-
 Death rates from indoor air pollution, OWID.svg 850 × 600; 140 KB
-
 Death rates from mental health and substance use disorders, OWID.svg 850 × 600; 141 KB
-
 Death rates from substance use disorders, OWID.svg 850 × 600; 141 KB
-
 Death rates from unsafe sanitation, OWID.svg 850 × 600; 140 KB
-
 Death rates from unsafe water sources, OWID.svg 850 × 600; 140 KB
-
 Death-rate-from-obesity-es.svg 850 × 600; 191 KB
-
 Death-rate-from-obesity.svg 850 × 600; 168 KB
-
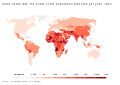
 Death-rate-from-rheumatic-heart-disease-who-ghe-age-standardized.png 3,400 × 2,857; 1,000 KB
-
 Death-rate-smoking.png 3,082 × 1,836; 487 KB
-
 Deaths from alcohol and drug use disorders, OWID.svg 850 × 600; 140 KB
-
 Deaths from alcohol use disorders, OWID.svg 850 × 600; 141 KB
-
 Deaths from conflict and terrorism (IHME, GBD (1990 to 2016)), OWID.svg 850 × 600; 140 KB
-
 Deaths from eating disorders, OWID.svg 850 × 600; 140 KB
-
 Deaths from mental health and substance use disorders, OWID.svg 850 × 600; 141 KB
-
 Deaths from natural disasters as a share of total deaths, OWID.svg 850 × 600; 140 KB
-
 Deaths from terrorism, OWID.svg 850 × 600; 142 KB
-
 Deaths-lead-exposure.png 3,400 × 2,400; 733 KB
-
 Drowning death rates – children under the age of 5, OWID.svg 850 × 600; 141 KB
-
 Drownings world map - Death - WHO2004.svg 940 × 415; 1.45 MB
-
 Falls world map - Death - WHO2004.svg 940 × 415; 1.45 MB
-
 Fire-death-rates.png 3,400 × 2,400; 733 KB
-
 Fires world map - Death - WHO2004.svg 940 × 415; 1.45 MB
-
 Has country already reached SDG target on child mortality., OWID.svg 850 × 600; 138 KB
-
 Has country already reached SDG target on maternal mortality., OWID.svg 850 × 600; 139 KB
-
 Has country already reached SDG target on neonatal mortality., OWID.svg 850 × 600; 139 KB
-
 Hiv-death-rates (1).png 3,400 × 2,400; 731 KB
-
 Homicide rate (IHME (1990 to 2017)), OWID.svg 850 × 600; 141 KB
-
 Homicide rate (World Bank (1995 to 2016)), OWID.svg 850 × 600; 141 KB
-
 Homicide rates from firearms (IHME, GBD (1990 to 2017)), OWID.svg 850 × 600; 140 KB
-
 Infectious-disease-death-rates.png 3,400 × 2,400; 732 KB
-
 Injuries world map - Death - WHO2004.svg 940 × 415; 1.45 MB
-
 Intentional injuries world map - Death - WHO2004.svg 940 × 415; 1.45 MB
-
 Leukaemia world map - Death - WHO2004.svg 940 × 415; 1.45 MB
-
 Liver cancer world map - Death - WHO2004.svg 940 × 415; 1.45 MB
-
 Lymphomas, multiple myeloma world map - Death - WHO2004.svg 940 × 415; 1.45 MB
-
 Magnitude of genocides between 1955 and 2014, OWID.svg 850 × 600; 140 KB
-
 Malignant neoplasms world map - Death - WHO2004.svg 940 × 415; 1.45 MB
-
 Map of cremation rates by country.png 6,460 × 3,426; 2.19 MB
-
 Map of Transgender People Murdered Worldwide in 2020.png 2,268 × 1,426; 851 KB
-
 Melanoma and other skin cancers world map - Death - WHO2004.svg 940 × 415; 1.45 MB
-
 Mortality caused by road traffic injury (per 100,000 people), OWID.svg 850 × 600; 141 KB
-
 Mortality from non-communicable diseases, OWID.svg 850 × 600; 140 KB
-

-
 Mouth and oropharynx cancers world map - Death - WHO2004.svg 940 × 415; 1.45 MB
-
 Natural disaster deaths by country, OWID.svg 850 × 600; 141 KB
-

-
 Natural population growth (UN (1950 to 2100)), OWID.svg 850 × 600; 140 KB
-
 Number of deaths from air pollution, 1, OWID.svg 850 × 600; 140 KB
-
 Number of deaths from air pollution, 2, OWID.svg 850 × 600; 139 KB
-
 Number of deaths from drug use disorders, OWID.svg 850 × 600; 141 KB
-
 Number of deaths from indoor air pollution, OWID.svg 850 × 600; 141 KB
-
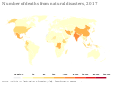 Number of deaths from natural disasters, OWID.svg 850 × 600; 140 KB
-
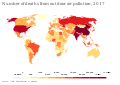 Number of deaths from outdoor air pollution, OWID.svg 850 × 600; 141 KB
-
 Number of deaths from road injuries, OWID.svg 850 × 600; 141 KB
-
 Number of homicide deaths, OWID.svg 850 × 600; 140 KB
-
 Number of known significant earthquakes, OWID.svg 850 × 600; 141 KB
-
 Number of suicide deaths from firearms, OWID.svg 850 × 600; 140 KB
-
 Number-of-neonatal-deaths-ihme.png 3,400 × 2,400; 742 KB
-
 Oesophagus cancer world map - Death - WHO2004.svg 940 × 415; 1.45 MB
-
 Other neoplasms world map - Death - WHO2004.svg 940 × 415; 1.45 MB
-
 Other unintentional injuries world map - Death - WHO2004.svg 940 × 415; 1.45 MB
-
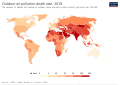 Outdoor air pollution death rate, 2019.svg 850 × 600; 163 KB
-
 Outdoor air pollution death rate, OWID.svg 850 × 600; 140 KB
-
 Ovary cancer world map - Death - WHO2004.svg 940 × 415; 1.45 MB
-

-
 Pancreas cancer world map - Death - WHO2004.svg 940 × 415; 1.15 MB
-

-
 Poisonings world map - Death - WHO2004.svg 940 × 415; 1.45 MB
-
 Pollution-deaths-from-fossil-fuels.jpg 3,400 × 2,400; 276 KB
-
 Population growth rate (UN (1950 to 2100)), OWID.svg 850 × 600; 140 KB
-
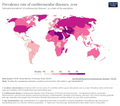 Prevalence-rate-of-cardiovascular-disease.png 3,400 × 3,007; 1.03 MB
-
 Prostate cancer world map - Death - WHO2004.svg 940 × 415; 1.45 MB
-
 Respiratory disease death rate, OWID.svg 850 × 600; 141 KB
-
 Respiratory-disease-death-rate.png 3,400 × 2,400; 735 KB
-
 Road traffic accidents world map - Death - WHO2004.svg 940 × 415; 1.45 MB
-
 Road traffic accidents world map - Death - WHO2012.svg 940 × 415; 1.45 MB
-
 Road traffic accidents world map - Death - WHO2013.svg 2,560 × 1,134; 1.14 MB
-
 Road traffic accidents world map - Death - WHO2016.png 1,800 × 820; 146 KB
-
 Road traffic death rate (per 100 000 population) - WHO 2019.svg 2,754 × 1,398; 1.06 MB
-

-
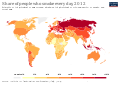
 Share of deaths attributed to obesity, OWID.svg 850 × 600; 140 KB
-
 Share of deaths from air pollution, OWID.svg 850 × 600; 140 KB
-
 Share of deaths from heart disease, OWID.svg 850 × 600; 140 KB
-
 Share of deaths from indoor air pollution, OWID.svg 850 × 600; 140 KB
-
 Share of deaths from outdoor air pollution, OWID.svg 850 × 600; 140 KB
-
 Share of deaths from suicide, OWID.svg 850 × 600; 140 KB
-
 Share of deaths from unsafe sanitation, OWID.svg 850 × 600; 140 KB
-
 Share of deaths from unsafe water sources, OWID.svg 850 × 600; 141 KB
-
 Share of road traffic deaths attributed to alcohol, OWID.svg 850 × 600; 140 KB
-
 Share-deaths-outdoor-pollution.png 3,400 × 2,400; 797 KB
-
 Share-deaths-smoking.png 3,124 × 1,889; 502 KB
-
 Share-of-adults-who-smoke.png 3,045 × 1,815; 491 KB
-
 Share-of-cancer-deaths-attributed-to-tobacco.jpg 3,400 × 2,400; 272 KB
-
 Share-of-cancer-deaths-attributed-to-tobacco.png 3,371 × 1,872; 584 KB
-
 Share-of-deaths-obesity.svg 850 × 600; 167 KB
-
 Stomach cancer world map - Death - WHO2004.svg 940 × 415; 1.45 MB
-
 Stroke death rates, OWID.svg 850 × 600; 141 KB
-
 Suicide death rates (World Bank (2000 to 2016)), OWID.svg 850 × 600; 141 KB
-
 Suicide rate by firearm, OWID.svg 850 × 600; 140 KB
-
 Tb-related-deaths-hiv.jpg 2,656 × 1,875; 506 KB
-
 Terrorism as a share of total deaths, OWID.svg 850 × 600; 140 KB
-
 Trachea, bronchus, lung cancers world map - Death - WHO2004.svg 940 × 415; 1.45 MB
-
 Tuberculosis-death-rates.png 3,400 × 2,400; 731 KB
-
 Tuberculosis-deaths.png 3,400 × 2,400; 727 KB
-
 Unintentional injuries world map - Death - WHO2004.svg 940 × 415; 1.45 MB
-
 Violence world map - Death - WHO2004.svg 940 × 415; 1.45 MB
-
 War world map - Death - WHO2004.svg 940 × 415; 1.45 MB


.svg)
.svg)
),_OWID.svg)


),_OWID.svg)


.png)
),_OWID.svg)
),_OWID.svg)
),_OWID.svg)


,_OWID.svg)

,_OWID.svg)


_(UN_(1950_to_2015)),_OWID.svg)
),_OWID.svg)


_and_for_the_highest_age-standardised_YLL_rate_per_100_000_population_(B),_for_each_country_or_territory,_2019.jpg)


),_OWID.svg)


_-_WHO_2019.svg)
_world_map_in_2019(WHO).png)


),_OWID.svg)


