Category:Cricket graphs
Jump to navigation
Jump to search
Graphs of cricket matches etc.
Subcategories
This category has the following 3 subcategories, out of 3 total.
Media in category "Cricket graphs"
The following 200 files are in this category, out of 203 total.
(previous page) (next page)-
 2005 Ashes, 1st Test, Australian run-rate, 1st innings.gif 1,018 × 694; 23 KB
-
 2005 Ashes, 1st Test, England run-rate, 1st innings.png 1,023 × 699; 10 KB
-
 2007 Cricket World Cup venues.png 548 × 395; 13 KB
-
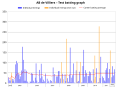
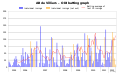 AB de Villiers ODI batting graph with 10-innings average.svg 3,440 × 2,120; 183 KB
-
 AB de Villiers ODI batting graph.svg 3,440 × 2,120; 192 KB
-
 AB de Villiers Test batting graph with 10-innings average.svg 3,520 × 2,640; 191 KB
-
 AB de Villiers Test batting graph.svg 3,520 × 2,640; 199 KB
-
 Shahid Afridi graph.png 986 × 574; 4 KB
-
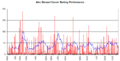
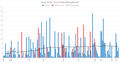
 Alastair Cook Complete Test Career Record.png 1,734 × 1,135; 121 KB
-
 Alastair Cook graph.png 986 × 574; 5 KB
-
 Alec Stewart Graph.png 963 × 492; 7 KB
-
 Allan Lamb graph.png 986 × 574; 6 KB
-
 Alvin Kallicharran graph.png 963 × 492; 6 KB
-
 Dennis Amiss graph.png 963 × 492; 6 KB
-
 Andrew Strauss graph.png 986 × 574; 5 KB
-
 Saeed Anwar graph.png 963 × 492; 6 KB
-
 Aravinda de Silva Test batting graph 10 innings average.svg 4,195 × 2,160; 17 KB
-
 Arthur Shrewsbury graph.png 986 × 574; 4 KB
-
 Ashesmatcheschart.png 331 × 210; 2 KB
-
 Ashesserieschart.png 331 × 210; 3 KB
-
 Mohammad Ashraful graph.png 986 × 574; 5 KB
-
 Nathan Astle graph.png 986 × 574; 5 KB
-
 Marvan Atapattu Graph.png 986 × 574; 6 KB
-
 Ken Barrington Graph.png 963 × 492; 7 KB
-
 Barry Jarman graph.png 483 × 359; 10 KB
-
 Ian Bell graph.png 986 × 574; 5 KB
-
 BestCompletedTestAverages.png 620 × 550; 54 KB
-
 BestTestAverages.png 846 × 566; 72 KB
-
 BestTestAverages0to100.png 850 × 579; 54 KB
-
 BestTestAverages50to100.png 850 × 579; 51 KB
-
 Jack Blackham graph.png 526 × 368; 11 KB
-
 Boland Shield graph.png 1,659 × 1,003; 122 KB
-
 David Boon Graph.png 963 × 492; 7 KB
-
 Ian Botham graph.png 986 × 574; 6 KB
-
 Geoff Boycott Graph.png 963 × 492; 7 KB
-
 Brad Hogg ODI batting graph 10 innings average.svg 1,845 × 1,140; 8 KB
-
 Brad Hogg ODI batting graph.svg 1,845 × 1,140; 9 KB
-
 Brendan Taylor ODI batting graph 10 innings average.svg 3,495 × 1,560; 14 KB
-
 Brendan Taylor ODI batting graph.svg 3,495 × 1,560; 15 KB
-
 Brian Lara Graph.png 986 × 540; 6 KB
-
 Ian Chappell graph.png 963 × 492; 7 KB
-
 Greg Chappell Graph.png 963 × 492; 7 KB
-
 Chris Gayle Graph.png 986 × 574; 5 KB
-
 Clark Curve 1.png 682 × 425; 16 KB
-
 Completed Test batting averages 10 or more innings, Barnes.jpg 849 × 433; 75 KB
-
 CompletedTestAveragesAbove50.png 620 × 550; 54 KB
-
 Colin Cowdrey Graph.png 963 × 492; 7 KB
-
 Bob Cowper Graph.png 963 × 492; 5 KB
-
 Ian Craig graph.png 571 × 377; 12 KB
-
 Cricket batting averages above 50 (completed).png 589 × 597; 19 KB
-
 Cricket batting averages above 50.png 775 × 467; 114 KB
-
 Cricket World Cup best results.png 1,425 × 625; 66 KB
-
 CricketBattingAverageHistogram.png 1,000 × 1,136; 146 KB
-
 CricketBattingStrikeRateHistogram.png 470 × 250; 3 KB
-
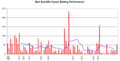
 Daryll Cullinan graph.png 963 × 492; 6 KB
-
 Damien Martyn Graph.png 986 × 540; 6 KB
-
 Aravinda de Silva Graph.png 963 × 492; 7 KB
-
 Denis Compton Graph.png 963 × 492; 7 KB
-
 Ted Dexter graph.png 963 × 492; 6 KB
-
 DGoughBowling.png 1,175 × 606; 15 KB
-
 Don Bradman Graph.png 963 × 492; 7 KB
-
 Don Bradman's First Class batting record.png 5,731 × 1,359; 353 KB
-
 Dudley Nourse Graph.png 963 × 492; 6 KB
-
 Eddie Paynter Graph.png 963 × 492; 5 KB
-
 Bill Edrich graph.png 963 × 492; 5 KB
-
 George Headley Graph.png 963 × 492; 5 KB
-
 David Gower Graph.png 963 × 492; 7 KB
-
 Graeme Pollock Graph.png 963 × 492; 5 KB
-
 Graham Gooch Graph.png 963 × 492; 7 KB
-
 Graham Thorpe graph.png 963 × 492; 7 KB
-
 Tom Graveney graph.png 963 × 492; 7 KB
-
 Gordon Greenidge Graph.png 963 × 492; 7 KB
-
 Greg Matthews graph.PNG 570 × 383; 14 KB
-
 Greg Ritchie graph.png 520 × 343; 11 KB
-
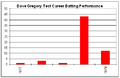 Dave Gregory graph.png 444 × 287; 6 KB
-
 Habibul Bashar graph.png 986 × 574; 5 KB
-
 Wally Hammond Graph.png 963 × 492; 7 KB
-
 Desmond Haynes Graph.png 963 × 492; 7 KB
-
 Patsy Hendren graph.png 963 × 492; 6 KB
-
 Herschelle Gibbs Graph.png 986 × 574; 6 KB
-
 Conrad Hunte graph.png 963 × 492; 6 KB
-
 Len Hutton Graph.png 963 × 492; 7 KB
-
 ICCTestChampionship2.PNG 792 × 154; 8 KB
-
 ICCWorldCricketLeague-2009-2014-en.svg 5,596 × 2,300; 48 KB
-
 ICCWorldCricketLeague-2009-2014-fr.svg 5,596 × 2,300; 48 KB
-
 Asif Iqbal graph.png 986 × 574; 6 KB
-
 Jack Crawford, test career batting chart (1906-1908).png 553 × 362; 14 KB
-
 Jack Fingleton graph.png 963 × 492; 5 KB
-
 Jack Hobbs Graph.png 963 × 492; 6 KB
-
 Jack Ryder graph.png 963 × 492; 5 KB
-
 Jacques Kallis Graph.png 986 × 574; 7 KB
-
 Sanath Jayasuriya Graph.png 986 × 574; 6 KB
-
 Jim Burke graph.png 567 × 356; 11 KB
-
 John Edrich Graph.png 963 × 492; 6 KB
-
 John Richard Reid graph.png 986 × 574; 5 KB
-
 Dean Jones graph.png 963 × 492; 6 KB
-
 Justin Langer Graph.png 986 × 574; 6 KB
-
 Rohan Kanhai graph.png 963 × 492; 6 KB
-
 Kevin Pietersen graph.png 986 × 574; 5 KB
-
 Kevin Pietersen ODI batting graph with 10-innings average.svg 3,280 × 2,080; 67 KB
-
 Kevin Pietersen ODI batting graph.svg 3,280 × 2,480; 68 KB
-
 Kevin Pietersen ODI graph.png 986 × 574; 5 KB
-
 Younis Khan Graph.png 986 × 574; 5 KB
-
 Gary Kirsten Graph.png 963 × 492; 7 KB
-
 Kumar Sangakkara Graph.png 986 × 574; 6 KB
-
 Bill Lawry graph.png 986 × 574; 6 KB
-
 Darren Lehmann graph.png 963 × 492; 5 KB
-
 Lindsay Hassett graph.png 963 × 492; 6 KB
-
 Clive Lloyd Graph.png 963 × 492; 7 KB
-
 Mahela Jayawardene graph.png 986 × 574; 6 KB
-
 Saleem Malik graph.png 963 × 492; 7 KB
-
 Marcus Trescothick Graph.png 986 × 574; 6 KB
-
 Mark Taylor ODI graph.png 569 × 386; 17 KB
-
 Mark Waugh ODI graph.png 888 × 552; 43 KB
-
 Martin Crowe Graph.png 963 × 492; 7 KB
-
 Matthew Hayden Graph.png 986 × 574; 6 KB
-
 Merv Hughes graph.PNG 580 × 392; 14 KB
-
 Javed Miandad Graph.png 963 × 492; 8 KB
-
 Michael Bevan graph.png 526 × 330; 10 KB
-
 Michael Clarke graph.png 986 × 574; 5 KB
-
 Michael Hussey graph.png 986 × 574; 5 KB
-
 Michael Vaughan Graph.png 986 × 574; 6 KB
-
 Mike Denness graph.png 986 × 574; 4 KB
-
 Mike Gatting graph.png 986 × 574; 6 KB
-
 MMuralidaranBowling.png 1,175 × 606; 18 KB
-
 Hanif Mohammad Graph.png 963 × 492; 6 KB
-
 Mudassar Nazar graph.png 963 × 492; 6 KB
-
 Neil Harvey Graph.png 986 × 574; 6 KB
-
 Norman Yardley, test career batting chart (1938-1950).png 677 × 385; 16 KB
-
 Paul Collingwood Graph.png 986 × 574; 5 KB
-
 Paul Collingwood ODI Graph.png 986 × 574; 6 KB
-
 Paul Reiffel graph.png 542 × 334; 12 KB
-
 Performance chart cricket Kent CCC (german).png 1,024 × 768; 84 KB
-
 Performance chart cricket Warwickshire CCC (german).png 1,024 × 768; 83 KB
-
 Performance chart cricket Worcestershire CCC (german).png 1,024 × 768; 84 KB
-
 Performance chart Derbyshire CCC (german).png 1,024 × 768; 81 KB
-
 Performance chart Durham CCC (german).png 1,024 × 768; 72 KB
-
 Performance chart Essex CCC (german).png 1,024 × 768; 82 KB
-
 Performance chart Glamorgan CCC (german).png 1,024 × 768; 76 KB
-
 Performance chart Gloucestershire CCC (german).png 1,024 × 768; 87 KB
-
 Performance chart Hampshire CCC (german).png 1,024 × 768; 84 KB
-
 Performance chart Lancashire CCC (german).png 1,024 × 768; 81 KB
-
 Performance chart Leicestershire CCC (german).png 1,024 × 768; 82 KB
-
 Performance chart Middlesex CCC (german).png 1,024 × 768; 86 KB
-
 Performance chart Northamptonshire CCC (german).png 1,024 × 768; 80 KB
-
 Performance chart Nottinghamshire CCC (german).png 1,024 × 768; 83 KB
-
 Performance chart Somerset CCC (german).png 1,024 × 768; 81 KB
-
 Performance chart Surrey CCC (german).png 1,024 × 768; 82 KB
-
 Performance chart Sussex CCC (german).png 1,024 × 768; 85 KB
-
 Performance chart Yorkshire CCC (german).png 1,024 × 768; 80 KB
-
 Peter May Graph.png 963 × 492; 6 KB
-
 Polly Umrigar graph.png 963 × 492; 6 KB
-
 Ricky Ponting Graph.png 986 × 574; 7 KB
-
 Ashwell Prince graph.png 986 × 574; 5 KB
-
 Progression and Reduction curves.png 1,454 × 434; 57 KB
-
 John Fulton Reid graph.png 986 × 574; 4 KB
-
 Wilfred Rhodes graph.png 963 × 492; 6 KB
-
 Mark Richardson graph.png 986 × 574; 5 KB
-
 Richie Richardson graph.png 963 × 492; 6 KB
-
 Richie Benaud graph.png 651 × 436; 18 KB
-
 Ricky Ponting Complete Test Career Record.png 1,734 × 1,135; 51 KB
-
 Lawrence Rowe Graph.png 963 × 492; 5 KB
-
 Ryan ten Doeschate ODI batting graph with 10-innings average.svg 1,520 × 1,280; 26 KB
-
 Ryan ten Doeschate ODI batting graph.svg 1,520 × 1,280; 26 KB
-
 Sachin Centuries Till 100.jpg 879 × 467; 47 KB
-
 Sachin Tendulkar Centuries per year till 100.svg 1,600 × 960; 53 KB
-
 Thilan Samaraweera graph.png 986 × 574; 5 KB
-
 Andy Sandham Graph.png 963 × 492; 4 KB
-
 Shivnarine Chanderpaul Graph.png 986 × 574; 6 KB
-
 Bob Simpson Graph.png 963 × 492; 6 KB
-
 Six Scenarios.png 634 × 66; 8 KB
-
 Michael Slater graph.png 963 × 492; 6 KB
-
 Graeme Smith Graph.png 986 × 574; 5 KB
-
 Garry Sobers Graph.png 963 × 492; 7 KB
-
 Stan McCabe graph.png 963 × 492; 6 KB
-
 Stephen Fleming Excel 2008.png 961 × 576; 11 KB
-
 Stephen Fleming graph.png 986 × 574; 6 KB
-
 Stephen Newton batting graph.png 914 × 500; 31 KB
-
 Steve Smith Graphical Test Batting Record.png 1,687 × 883; 35 KB
-
 Steve Waugh Graph.png 963 × 492; 8 KB
-
 Scott Styris graph.png 986 × 574; 5 KB
-
 Bert Sutcliffe graph.png 963 × 492; 6 KB
-
 Herbert Sutcliffe.png 963 × 492; 6 KB
-
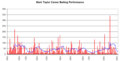 Mark Taylor Graph.png 963 × 492; 7 KB
-
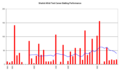
 Test batting averages 10 or more innings.jpg 549 × 529; 69 KB
-
 Test Rankings since Jun 2003.png 1,428 × 521; 76 KB
-
 Hashan Tillakaratne graph.png 986 × 574; 6 KB
-
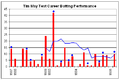 Tim May graph.PNG 460 × 305; 9 KB
-
 Tom Horan graph.png 424 × 347; 7 KB
-
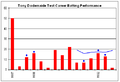 Tony Dodemaide graph.png 489 × 333; 8 KB
-
 Glenn Turner graph.png 963 × 492; 6 KB
-
 Inzamam-ul-Haq Graph.png 986 × 574; 6 KB
-
 Victor Trumper Graph.png 963 × 492; 6 KB
-
 Vijay Hazare graph.png 957 × 539; 6 KB
-
 Viv Richards Graph.png 963 × 492; 7 KB
-
 Clyde Walcott Graph.png 963 × 492; 6 KB
-
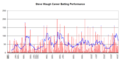
 Doug Walters graph.png 963 × 492; 7 KB
-
 Mark Waugh Graph.png 963 × 492; 7 KB
-
 Everton Weekes Graph.png 963 × 492; 6 KB
-
 Frank Worrell Graph.png 963 × 492; 6 KB


.png)


.png)


.png)


.png)
.png)
.png)
.png)
.png)
.png)
.png)
.png)
.png)
.png)
.png)
.png)
.png)
.png)
.png)
.png)
.png)
.png)


