Category:Charts combining birth and death rates
Jump to navigation
Jump to search
A category for birth and death rates graphs, usually both graphs on the same picture.
Media in category "Charts combining birth and death rates"
The following 88 files are in this category, out of 88 total.
-
 111 демография.png 303 × 178; 4 KB
-
 222 демография.JPG 405 × 340; 16 KB
-
 444 демография.png 513 × 364; 8 KB
-
 Bevoelkerungsentwicklung deutschland.png 2,150 × 1,450; 122 KB
-
 Bevoelkerungsentwicklung in Oesterreich.jpg 6,160 × 4,000; 1.38 MB
-
 Bevoelkerungsentwicklung in Oesterreich.svg 1,350 × 810; 68 KB
-
 Bevölkerungentwicklung Deutschland 1950-2014.svg 1,002 × 671; 123 KB
-
 Bevölkerungsentwicklung Deutschland Variante.svg 1,350 × 810; 48 KB
-
 Bevölkerungsentwicklung Deutschland.svg 1,350 × 810; 71 KB
-
 Bevölkerungsentwicklung Schweiz.svg 1,350 × 810; 78 KB
-
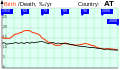 BirthDeath 1950 AT.svg 480 × 280; 8 KB
-
 BirthDeath 1950 AU.svg 480 × 320; 8 KB
-
 BirthDeath 1950 BA.svg 480 × 360; 9 KB
-
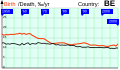 BirthDeath 1950 BE.svg 480 × 280; 8 KB
-
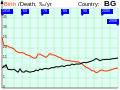 BirthDeath 1950 BG.svg 480 × 360; 9 KB
-
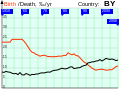 BirthDeath 1950 BY.svg 480 × 360; 9 KB
-
 BirthDeath 1950 CA.svg 480 × 320; 8 KB
-
 BirthDeath 1950 CH.svg 480 × 280; 8 KB
-
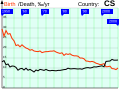 BirthDeath 1950 CS.svg 480 × 360; 9 KB
-
 BirthDeath 1950 CZ.svg 480 × 320; 9 KB
-
 BirthDeath 1950 DE.svg 480 × 280; 8 KB
-
 BirthDeath 1950 DK.svg 480 × 280; 8 KB
-
 BirthDeath 1950 EE.svg 480 × 280; 8 KB
-
 BirthDeath 1950 ES.svg 480 × 280; 8 KB
-
 BirthDeath 1950 FI.svg 480 × 280; 8 KB
-
 BirthDeath 1950 FR.svg 480 × 280; 8 KB
-
 BirthDeath 1950 GB.svg 480 × 280; 8 KB
-
 BirthDeath 1950 GR.svg 480 × 320; 8 KB
-
 BirthDeath 1950 HR.svg 480 × 360; 9 KB
-
 BirthDeath 1950 HU.svg 480 × 320; 9 KB
-
 BirthDeath 1950 IE.svg 480 × 280; 8 KB
-
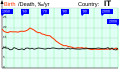 BirthDeath 1950 IT.svg 480 × 280; 8 KB
-
 BirthDeath 1950 JP.svg 480 × 320; 8 KB
-
 BirthDeath 1950 KR.svg 480 × 400; 9 KB
-
 BirthDeath 1950 LT.svg 480 × 360; 9 KB
-
 BirthDeath 1950 LV.svg 480 × 280; 8 KB
-
 BirthDeath 1950 MD.svg 480 × 360; 9 KB
-
 BirthDeath 1950 MK.svg 480 × 360; 9 KB
-
 BirthDeath 1950 NL.svg 480 × 280; 8 KB
-
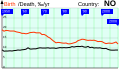 BirthDeath 1950 NO.svg 480 × 280; 8 KB
-
 BirthDeath 1950 NZ.svg 480 × 320; 8 KB
-
 BirthDeath 1950 PL.svg 480 × 320; 8 KB
-
 BirthDeath 1950 PT.svg 480 × 280; 8 KB
-
 BirthDeath 1950 RO.svg 480 × 360; 9 KB
-
 BirthDeath 1950 RU.svg 480 × 280; 8 KB
-
 BirthDeath 1950 SE.svg 480 × 280; 8 KB
-
 BirthDeath 1950 SI.svg 480 × 320; 8 KB
-
 BirthDeath 1950 SK.svg 480 × 320; 8 KB
-
 BirthDeath 1950 UA.svg 480 × 280; 8 KB
-
 BirthDeath 1950 US.svg 480 × 320; 8 KB
-
 BirthDeath 1979 RU.svg 256 × 256; 4 KB
-
 Births and deaths balance in Athens metropolitan area 1936 - 1943.svg 1,116 × 645; 16 KB
-
 Crepob Sevilla.png 1,030 × 574; 34 KB
-
 English Wikipedia categories by birth and death year.png 600 × 371; 17 KB
-
 Evolution des principaux indicateurs de russie.png 800 × 471; 101 KB
-
 Geburtenrate (l. R.).png 684 × 266; 33 KB
-
 Geburtenrate (L.R.).png 803 × 287; 42 KB
-
 Geburtenrate (n.-l. R.).png 760 × 410; 39 KB
-
 Geburtenrate (N.-L. R.).png 591 × 321; 29 KB
-
 Halálozási szám változása Csongoron 2000-2011 között (fő).jpg 578 × 270; 34 KB
-
 Income death in logs graph.JPG 744 × 485; 46 KB
-
-
 Le taux de fécondité en Russie de 1990 à 2008.png 775 × 496; 69 KB
-
 Movimento naturale della popolazione nel comune di Morbengo.png 583 × 343; 11 KB
-
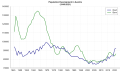
 Nascite e morti in Italia, 1862 - 2016.png 1,582 × 843; 92 KB
-
 Natural Population Growth of Russia rus.PNG 831 × 508; 27 KB
-
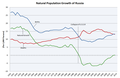 Natural Population Growth of Russia.PNG 922 × 603; 41 KB
-
 Number of Births and Deaths, Japan.svg 640 × 480; 8 KB
-
 Population Development Austria.svg 1,350 × 810; 65 KB
-
 Population Development Germany.svg 1,350 × 810; 65 KB
-
 Population Development Switzerland.svg 1,350 × 810; 75 KB
-
 PSM V71 D221 Percentage increments up to birth in humans by lunar months.png 836 × 2,022; 74 KB
-
 PSM V71 D482 Average annual birth rates by decades in europe.png 1,429 × 1,867; 221 KB
-
 PSM V71 D483 Average annual european death rates by decade.png 1,403 × 1,867; 237 KB
-
 RUS births deaths 195601-202202.png 1,553 × 868; 164 KB
-
 Russian Cross.jpg 427 × 361; 37 KB
-

-
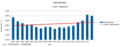
 Születések számának változása Csongoron 2000-2011 között (fő).jpg 597 × 258; 30 KB
-
 Vital statistics Bulgaria.tif 1,192 × 682; 223 KB
-
 Виктория.png 428 × 285; 35 KB
-
 Графика на раждаемостта и смъртността в България.JPG 1,486 × 995; 284 KB
-
 Графика на раждаемостта и смъртността в България.png 1,486 × 995; 18 KB
-

-
 Естественное движение России 1927-1940.png 833 × 526; 31 KB
-
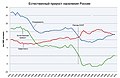 Естественный прирост населения России.jpg 922 × 603; 207 KB
-
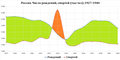 Россия. Число рождений, смертей (тыс чел) 1927-1940.png 1,083 × 538; 37 KB
-
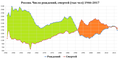 Россия. Число рождений, смертей (тыс чел) 1946-2017.png 1,076 × 532; 54 KB
-
 Россия. Число рождений, смертей (тыс чел) 1946-2020.png 1,308 × 653; 41 KB


.png)
.png)
.jpg)

_--_Italy_-_natural_increase_(births_and_deaths)_(1862-).png)


.png)
.jpg)


_%D0%B2_%D0%A0%D0%BE%D1%81%D1%81%D0%B8%D0%B8_%D0%B2_1978%E2%80%932005_%D0%B3%D0%B3..gif)


_1927-1940.png)
_1946-2017.png)
_1946-2020.png)
.png)
.png)