Category:Charts about Łódź
Jump to navigation
Jump to search
Media in category "Charts about Łódź"
The following 18 files are in this category, out of 18 total.
-
 Ludność miasta Łodzi w latach 1985-2005.png 593 × 565; 124 KB
-
 Natural increase of Łódź in 1985-2005 (per 1000 population).png 594 × 565; 99 KB
-
 Piramida wieku Lodz 2021.png 1,287 × 714; 318 KB
-
 Piramida wieku Lodz.png 1,000 × 800; 56 KB
-
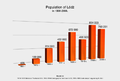 Population of Łódź in 1800-2006.png 836 × 565; 104 KB
-
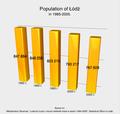 Population of Łódź in 1985-2005.png 593 × 565; 122 KB
-
 Population projection of Łódź 2010-2030.png 594 × 567; 120 KB
-
 Precipitations and average monthly air temperatures in Łódź in 2005.png 593 × 564; 131 KB
-
 Precipitations and average monthly air temperatures in Łódź in 2005.svg 593 × 564; 580 KB
-
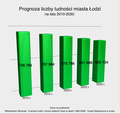 Prognoza liczby ludności miasta Łodzi na lata 2010-2030.png 594 × 566; 123 KB
-

-
 Rozwój demograficzny miasta Łodzi w latach 1800-2006.png 836 × 565; 109 KB
-
 Ruch naturalny miasta Łodzi w latach 1985-2005.png 594 × 566; 159 KB
-
 Studenci szkół wyższych (cywilnych) w Łodzi w latach 1975-2005.png 593 × 564; 97 KB
-
 Students of higher (civil) schools in Łódź in 1975-2005.png 593 × 564; 94 KB
-
 Vital statistics of Łódź in 1985-2005.png 594 × 566; 156 KB
-
 Łódź population pyramid.svg 3,190 × 2,541; 31 KB
-


.png)


.png)


_w_%C5%81odzi_w_latach_1975-2005.png)
_schools_in_%C5%81%C3%B3d%C5%BA_in_1975-2005.png)


