Category:Allele, genotype or phenotype frequency maps (human)
Jump to navigation
Jump to search
English: Distribution maps of allele frequency or genotype frequency or phenotype frequency in homo sapiens.
Subcategories
This category has the following 5 subcategories, out of 5 total.
Media in category "Allele, genotype or phenotype frequency maps (human)"
The following 72 files are in this category, out of 72 total.
-
 2ltivrk.jpg 813 × 224; 93 KB
-
 45332601nd7 (1).jpg 815 × 972; 276 KB
-
 Ala111Thr allele frequency distribution0.png 1,466 × 664; 889 KB
-
 ALDH2 rs671 genotype frequency.png 4,000 × 2,250; 1.67 MB
-
 Allele frequency analysis for eye and skin color loci at 15q13.1.png 2,467 × 1,074; 524 KB
-
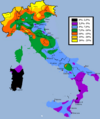
 Anthropological maps of Italy.png 2,356 × 1,600; 2.59 MB
-

-
 B-0702.png 651 × 429; 39 KB
-
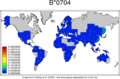 B-0704.png 651 × 429; 38 KB
-
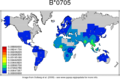 B-0705.png 651 × 429; 39 KB
-
 B-0801.png 651 × 429; 40 KB
-
 B-1301.png 651 × 429; 37 KB
-
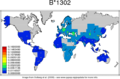 B-1302.png 651 × 429; 38 KB
-
 B-1401.png 651 × 429; 37 KB
-
 B-1402.png 651 × 429; 39 KB
-
 B-1403.png 651 × 429; 38 KB
-
 B81 Frequency.PNG 169 × 240; 5 KB
-
 BiasuttiMappa.gif 1,197 × 1,430; 103 KB
-
 BiasuttiMappa.png 1,197 × 1,430; 1.45 MB
-
 Blond hair Italy.png 1,197 × 1,430; 97 KB
-

-
 Brown hair Italy in 1863.png 1,082 × 1,312; 805 KB
-

-
 Continental Asia (Genetic groups and ancient cultures, 5000 BCE-1000 CE, original).png 3,333 × 2,627; 5.46 MB
-
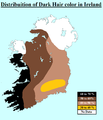 Dark Hair Ireland.png 1,192 × 1,392; 103 KB
-

-
 F1 large.jpg 1,316 × 1,052; 290 KB
-
 F2-large.jpg 1,280 × 928; 253 KB
-

-
-
 Genetic Difference.png 7,200 × 4,294; 2.22 MB
-
 Geospatial distribution of SNP rs1426654-A allele.png 2,066 × 1,505; 715 KB
-
 Groupa.png 300 × 165; 13 KB
-
 Groupb.png 300 × 164; 11 KB
-
 Haplotype analysis of sickle-cell trait.png 1,181 × 837; 322 KB
-
 HLA-G map.jpg 1,022 × 609; 87 KB
-

-
 LacIntol-World2.png 1,427 × 628; 52 KB
-
 Lactase map2.jpg 2,580 × 2,026; 785 KB
-
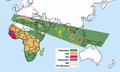
 Lactase persistence in the Old World.svg 512 × 402; 118 KB
-
 Lactase shrunk.jpg 600 × 471; 31 KB
-
 Lactose tolerance in the Old World.svg 512 × 402; 151 KB
-
 Laktoseintoleranz-1.svg 2,535 × 1,263; 1.44 MB
-
 Light hair coloration map.png 1,000 × 801; 136 KB
-
 Malaria versus sickle-cell trait distributions.png 1,346 × 726; 224 KB
-
 Map of blood group a.gif 516 × 284; 16 KB
-
 Map of blood group b.gif 518 × 283; 16 KB
-
 Map of blood group o.gif 516 × 284; 16 KB
-
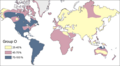 Map of Group O.png 516 × 284; 42 KB
-
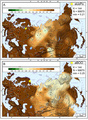
 Map of Mongolia (Early Iron Age).png 2,011 × 993; 5.04 MB
-
 Mapa del grupo O.GIF 516 × 284; 15 KB
-
 Migration routes of subtypes of Helicobacter pylori.png 1,281 × 703; 153 KB
-
 MtDNA haplogroup tree and distribution map.gif 2,820 × 1,365; 380 KB
-
 OCA2 Asia large.png 1,011 × 388; 329 KB
-
 OCA2 Asia small.png 418 × 388; 182 KB
-
 OCA2 labels S.png 1,435 × 695; 1.15 MB
-
 PiMS Europe.png 1,245 × 1,245; 91 KB
-
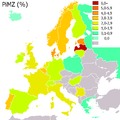 PiMZ Europe.png 1,245 × 1,245; 90 KB
-
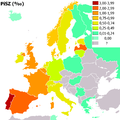 PiSZ Europe.png 1,245 × 1,245; 91 KB
-
 PiZZ Europe.png 1,245 × 1,245; 65 KB
-
 Present-day population affinities of the IUP Bacho Kiro Cave individuals.jpg 1,676 × 937; 550 KB
-
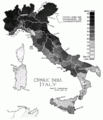 PSM V51 D742 Cephalic index of italy.png 2,227 × 2,589; 489 KB
-
 PSM V51 D745 Relative frequency of brunet traits.png 2,247 × 2,563; 465 KB
-
 Red Blood Cell abnormalities.png 1,759 × 1,053; 955 KB
-
 Sickle cell distribution.jpg 351 × 240; 75 KB
-
 Spatiotemporal distribution and admixture of ancient genomes.webp 1,985 × 2,317; 267 KB
-
 Weltkarte-Körperbehaarung.png 1,906 × 955; 346 KB
-
 World distribution of A111T polymorphism in SLC24A5.png 1,280 × 469; 666 KB
-
 World map ABCC11 A Allele.svg 718 × 475; 864 KB
-
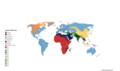
 World map of lactose intolerance.png 1,427 × 628; 38 KB
-
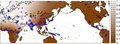
 World SZ.jpg 4,677 × 3,307; 1.08 MB
-
 Worldwide prevalence of lactose intolerance in recent populations.jpg 1,722 × 1,187; 364 KB
.jpg)


_with_Mongolia_zone.png)
.png)

.png)


_and_present-day_Eurasian_samples.png)


.png)


.png)