File:WTI price 96 09.svg

Original file (SVG file, nominally 600 × 480 pixels, file size: 60 KB)
Captions
Captions
Summary[edit]
| DescriptionWTI price 96 09.svg |
English: Updated version of Image:WTI price 96 09.PNG
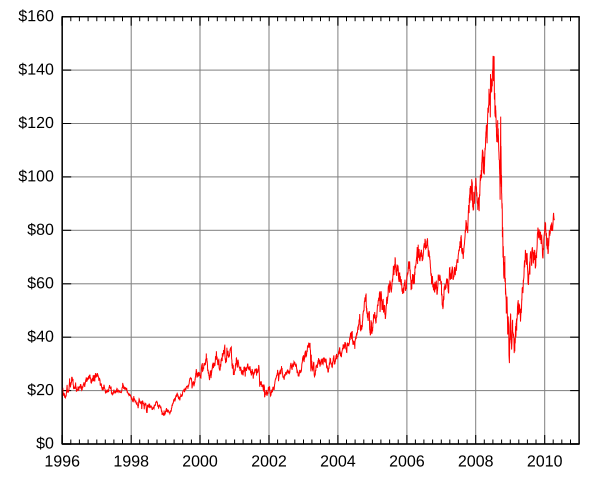
Petroleum prices or oil prices through recent history. Price of oil. Oil price increase. Oil price runup. Oil price crash. Y-axis: Dollars per barrel for NYMEX sweet light crude WTI X-axis: year http://en.wikipedia.org/wiki/File:Oil_Prices_Medium_Term.png Ten-day moving average of prices of NYMEX Light Sweet Crude. Data from the Energy Information Administration (EIA). Prices are nominal (not adjusted for inflation). http://tonto.eia.doe.gov/dnav/pet/pet_pri_spt_s1_d.htm |
| Date | |
| Source | Own work |
| Author | Theanphibian |
| Other versions |
|
| SVG development InfoField |
Licensing[edit]
| Public domainPublic domainfalsefalse |
| I, the copyright holder of this work, release this work into the public domain. This applies worldwide. In some countries this may not be legally possible; if so: I grant anyone the right to use this work for any purpose, without any conditions, unless such conditions are required by law. |
File history
Click on a date/time to view the file as it appeared at that time.
| Date/Time | Thumbnail | Dimensions | User | Comment | |
|---|---|---|---|---|---|
| current | 20:53, 20 April 2010 |  | 600 × 480 (60 KB) | Theanphibian (talk | contribs) | Added "$" symbol |
| 17:45, 20 April 2010 |  | 600 × 480 (60 KB) | Theanphibian (talk | contribs) | Changed program used and source referenced. Now data from EIA: http://tonto.eia.doe.gov/dnav/pet/pet_pri_spt_s1_d.htm Category:Gnuplot diagrams Category:Oil prices Category:Petroleum | |
| 02:46, 4 June 2009 |  | 621 × 435 (86 KB) | Theanphibian (talk | contribs) | {{Information |Description={{en|1=Updated version of Image:WTI price 96 09.PNG Y-axis: Dollars per barrel for NYMEX sweet light crude WTI X-axis: year http://en.wikipedia.org/wiki/File:Oil_Prices_Medium_Term.png Ten-day moving average of prices of |
You cannot overwrite this file.
File usage on Commons
There are no pages that use this file.
File usage on other wikis
The following other wikis use this file:
- Usage on id.wikipedia.org
Metadata
This file contains additional information such as Exif metadata which may have been added by the digital camera, scanner, or software program used to create or digitize it. If the file has been modified from its original state, some details such as the timestamp may not fully reflect those of the original file. The timestamp is only as accurate as the clock in the camera, and it may be completely wrong.
| Image title | Produced by GNUPLOT 4.4 patchlevel 0 |
|---|---|
| Width | 600 |
| Height | 480 |
