File:VanderWaals liquefazione CO2.jpg
VanderWaals_liquefazione_CO2.jpg (542 × 523 pixels, file size: 55 KB, MIME type: image/jpeg)
Captions
Captions
| DescriptionVanderWaals liquefazione CO2.jpg |
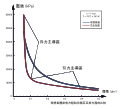
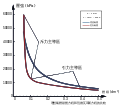
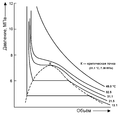
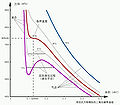
Questo grafico pressione-volume rappresenta le isoterme relative al biossido di carbonio in prossimità del punto di liquefazione. Le curve sono state calcolate utilizzando la legge di Van der Waals ed il grafico è stato realizzato in Excel. L'autore del grafico ha anche effettuato l'upload dell'immagine (non ci sono quindi problemi relativamente al copyright) |
||||||||
| Date | Commons upload by Shizhao 14:18, 22 May 2006 (UTC) | ||||||||
| Source |
Originally from it.wikipedia; description page is (was) here
|
||||||||
| Author | User Marc Lagrange on it.wikipedia | ||||||||
| Permission (Reusing this file) |
other_versions=
[edit]
.png:
.jpg:
|
 | This image was uploaded in the JPEG format even though it consists of non-photographic data. This information could be stored more efficiently or accurately in the PNG or SVG format. If possible, please upload a PNG or SVG version of this image without compression artifacts, derived from a non-JPEG source (or with existing artifacts removed). After doing so, please tag the JPEG version with {{Superseded|NewImage.ext}} and remove this tag. This tag should not be applied to photographs or scans. If this image is a diagram or other image suitable for vectorisation, please tag this image with {{Convert to SVG}} instead of {{BadJPEG}}. If not suitable for vectorisation, use {{Convert to PNG}}. For more information, see {{BadJPEG}}. |
File history
Click on a date/time to view the file as it appeared at that time.
| Date/Time | Thumbnail | Dimensions | User | Comment | |
|---|---|---|---|---|---|
| current | 14:18, 22 May 2006 |  | 542 × 523 (55 KB) | Shizhao (talk | contribs) | {{Information| |Description= Questo grafico pressione-volume rappresenta le isoterme relative al biossido di carbonio in prossimità del punto di liquefazione. Le curve sono state calcolate utilizzando la legge di Van der Waals ed il grafico è stato real |
You cannot overwrite this file.
File usage on Commons
The following 12 pages use this file:
- Johannes Diderik van der Waals
- File:Carbon dioxide isotherms-en.svg
- File:Carbon dioxide isotherms-ru.svg
- File:Carbon dioxide isotherms.png
- File:Heike Kamerlingh Onnes - 11 - Carbon dioxide isotherms.png
- File:VanderWaals liquefazione CO2.jpg
- File:VdW-Attr-Repul.jpg
- File:VdW-Attr-Repul SVG path.svg
- File:VdW-Attr-Repul SVG text.svg
- File:VdW liquefaction CO2.JPG
- File:VdW liquefaction CO2.jpg
- Template:Other versions/Carbon dioxide isotherms
File usage on other wikis
The following other wikis use this file:
- Usage on fi.wikipedia.org
- Usage on it.wikipedia.org
- Usage on it.wikibooks.org
- Usage on it.wikiversity.org
- Usage on sv.wikipedia.org
Metadata
This file contains additional information such as Exif metadata which may have been added by the digital camera, scanner, or software program used to create or digitize it. If the file has been modified from its original state, some details such as the timestamp may not fully reflect those of the original file. The timestamp is only as accurate as the clock in the camera, and it may be completely wrong.
| _error | 0 |
|---|


