File:Union Membership in the United States, 1960-2020.svg
Jump to navigation
Jump to search

Size of this PNG preview of this SVG file: 540 × 360 pixels. Other resolutions: 320 × 213 pixels | 640 × 427 pixels | 1,024 × 683 pixels | 1,280 × 853 pixels | 2,560 × 1,707 pixels.
Original file (SVG file, nominally 540 × 360 pixels, file size: 40 KB)
Captions
Captions
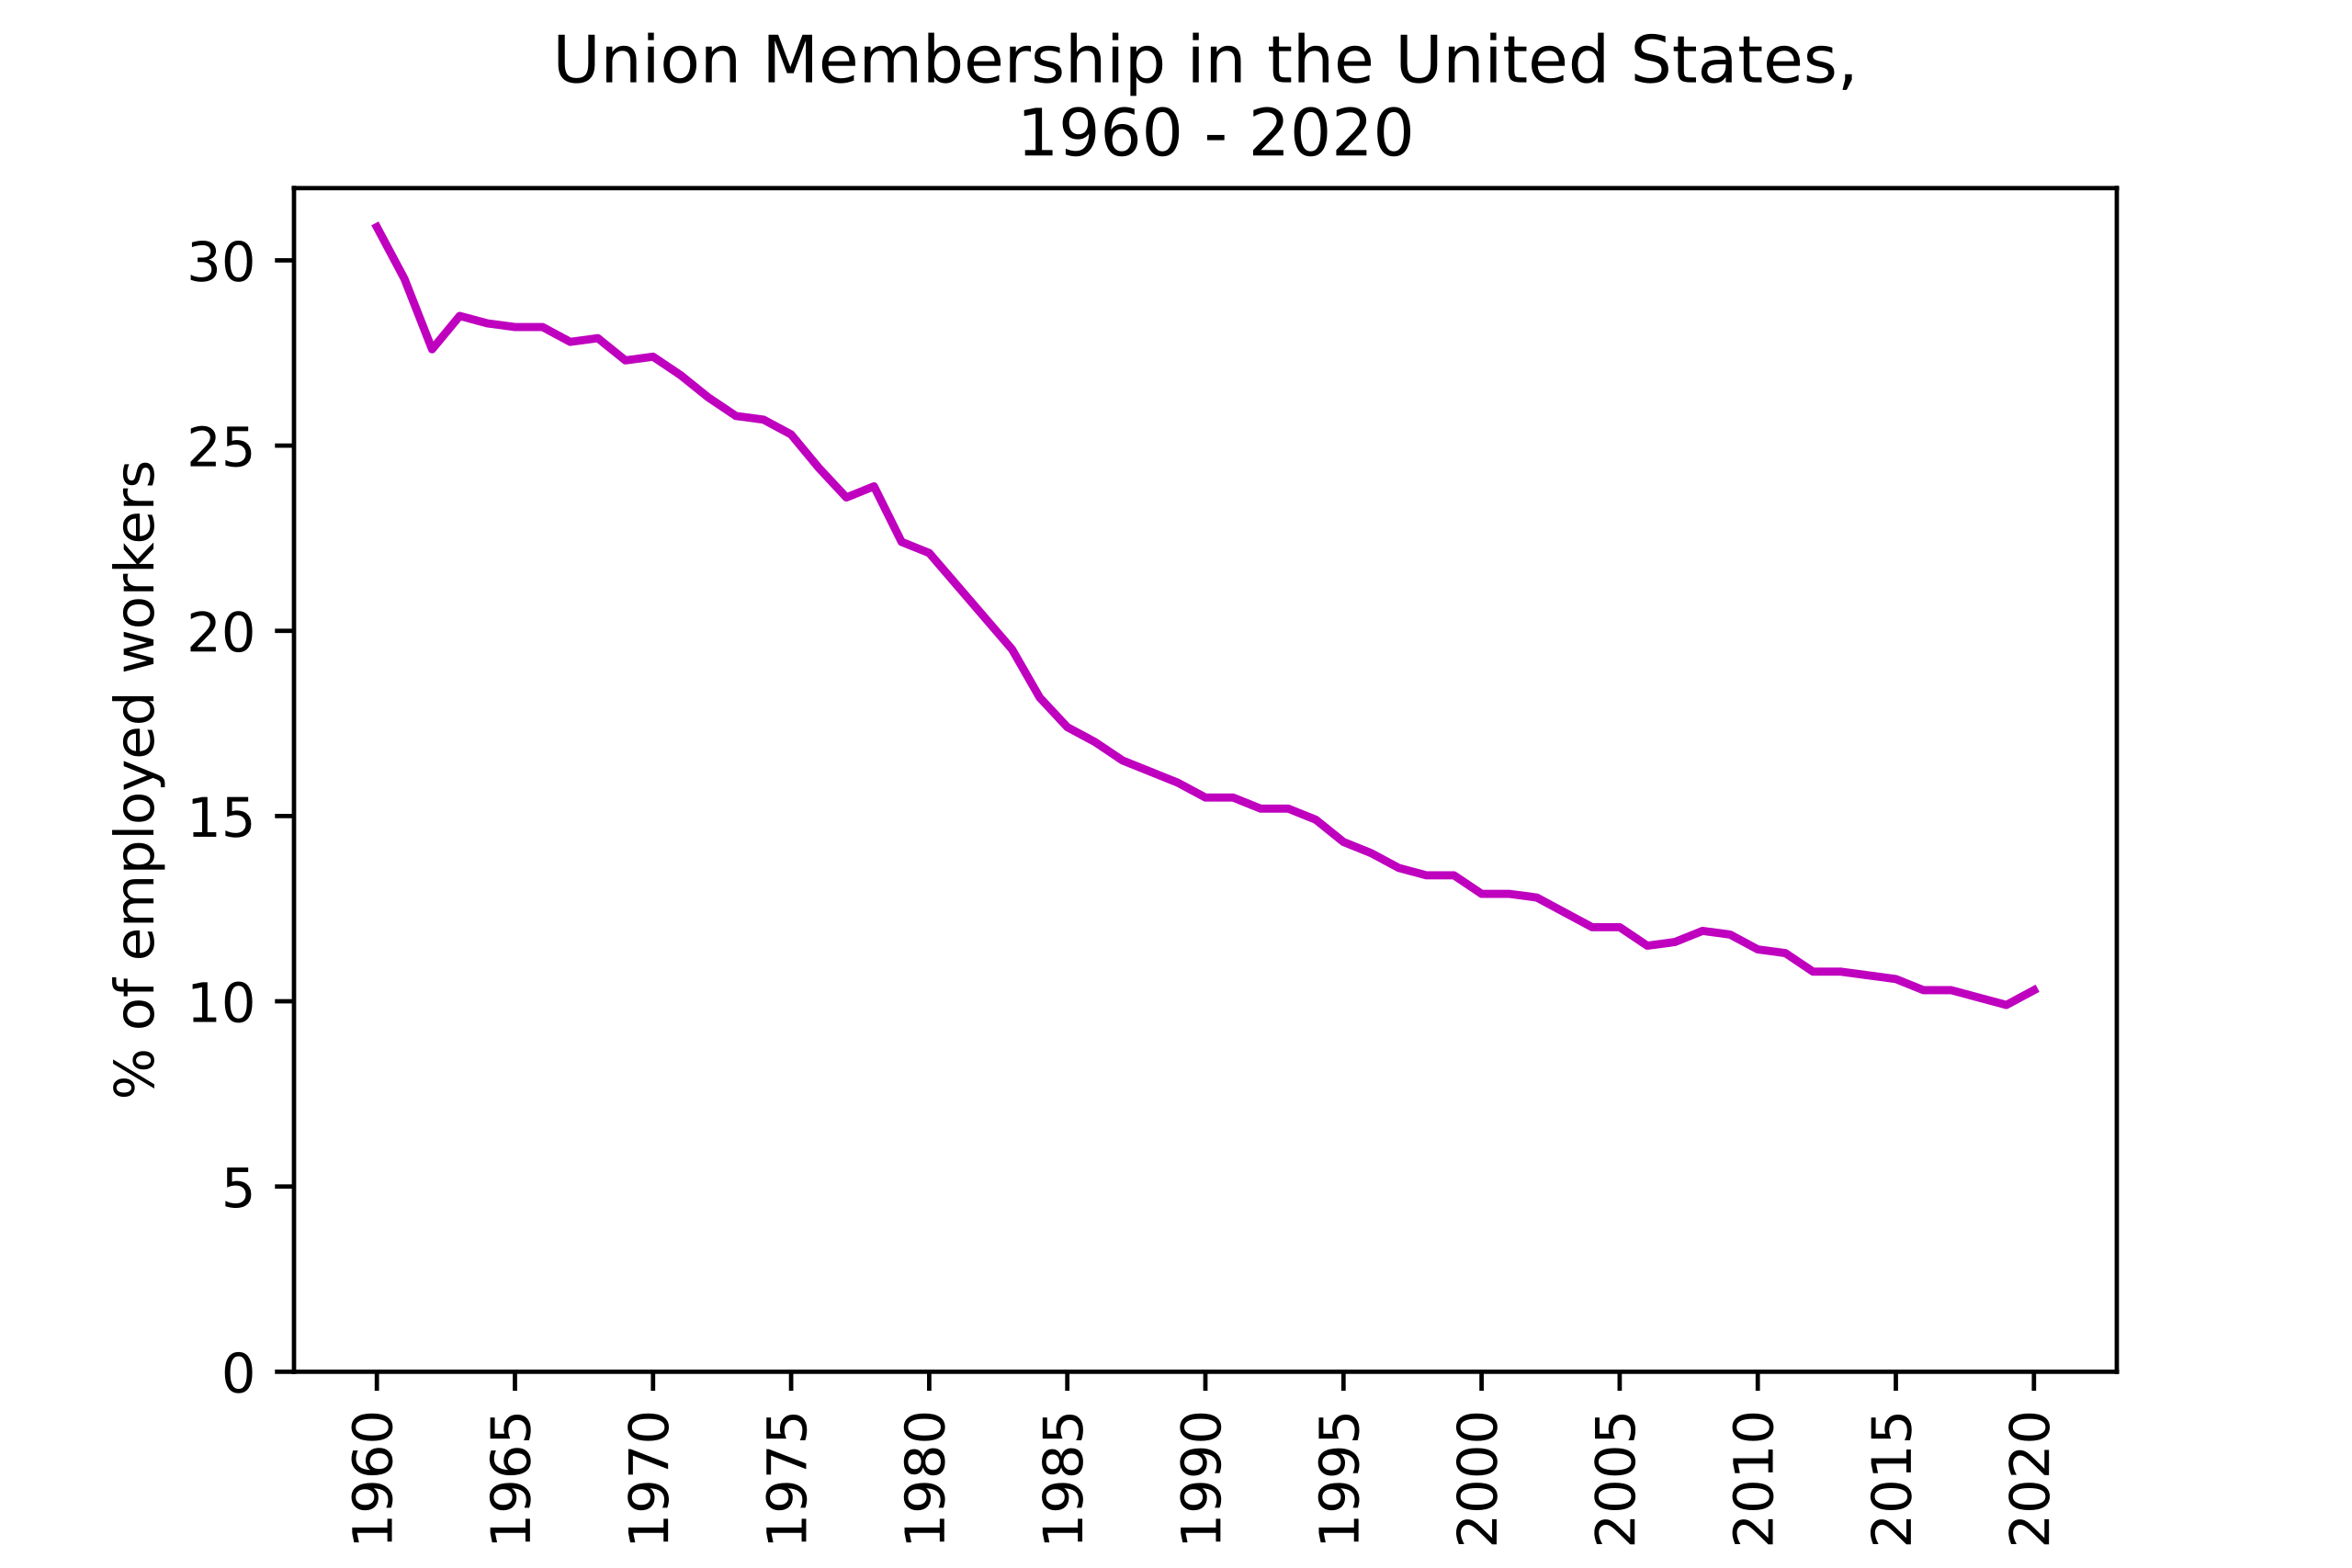
Union Membership in the United States, % of employed workers
Summary[edit]
}
| Description |
English: Union Membership in the United States, % of employed workers from 1960-2020. Source: OECD Trade Union Dataset, Trade Union Density table, accessed April 29, 2022 |
| Date | |
| Source | Own work |
| Author | William Chen |
| SVG development | This plot was created with Matplotlib. |
| Source code | Python code#!/usr/bin/env python
# -*- coding: utf-8 -*-
"""
Created on Fri Apr 29, 2022
@author: William Chen
"""
import numpy as np
import matplotlib.pyplot as pyplot
# Source: OECD Trade Union Dataset (Trade Union Density)
# Accessed April 29, 2022
# https://stats.oecd.org/Index.aspx?DataSetCode=TUD
year = [
1960,
1961,
1962,
1963,
1964,
1965,
1966,
1967,
1968,
1969,
1970,
1971,
1972,
1973,
1974,
1975,
1976,
1977,
1978,
1979,
1980,
1983,
1984,
1985,
1986,
1987,
1988,
1989,
1990,
1991,
1992,
1993,
1994,
1995,
1996,
1997,
1998,
1999,
2000,
2001,
2002,
2003,
2004,
2005,
2006,
2007,
2008,
2009,
2010,
2011,
2012,
2013,
2014,
2015,
2016,
2017,
2018,
2019,
2020]
unionMembership = [
30.9,
29.5,
27.6,
28.5,
28.299999,
28.200001,
28.200001,
27.799999,
27.9,
27.299999,
27.4,
26.9,
26.299999,
25.799999,
25.700001,
25.299999,
24.4,
23.6,
23.9,
22.4,
22.1,
19.5,
18.200001,
17.4,
17,
16.5,
16.200001,
15.9,
15.5,
15.5,
15.2,
15.2,
14.9,
14.3,
14,
13.6,
13.4,
13.4,
12.9,
12.9,
12.8,
12.4,
12,
12,
11.5,
11.6,
11.9,
11.8,
11.4,
11.3,
10.8,
10.8,
10.7,
10.6,
10.3,
10.3,
10.1,
9.8999996,
10.3]
## Specify start and end year for chart, create numpy array
np_union = np.array([year, unionMembership])
year_start = int(np_union[0][0])
year_end = int(np_union[0][-1])
# tick_years is every x years to be displayed as x axes labels
tick_years = 5
## Function to find years divisible by tick_years
def check_divisible(year_input):
if year_input % tick_years == 0:
return True
## Chart formatting
pyplot.title(f"Union Membership in the United States,\n {year_start} - {year_end}")
pyplot.xlabel("Year")
pyplot.ylabel("% of employed workers")
pyplot.xticks(list(filter(check_divisible, list(np_union[0]))),rotation=90)
# Plot
pyplot.plot(np_union[0], np_union[1],'m')
# Start plot from 0
pyplot.gca().set_ylim(bottom=0)
pyplot.savefig('unionMembership.svg', dpi=300)
pyplot.show()
|
Licensing[edit]
I, the copyright holder of this work, hereby publish it under the following license:
This file is licensed under the Creative Commons Attribution-Share Alike 4.0 International license.
- You are free:
- to share – to copy, distribute and transmit the work
- to remix – to adapt the work
- Under the following conditions:
- attribution – You must give appropriate credit, provide a link to the license, and indicate if changes were made. You may do so in any reasonable manner, but not in any way that suggests the licensor endorses you or your use.
- share alike – If you remix, transform, or build upon the material, you must distribute your contributions under the same or compatible license as the original.
File history
Click on a date/time to view the file as it appeared at that time.
| Date/Time | Thumbnail | Dimensions | User | Comment | |
|---|---|---|---|---|---|
| current | 19:06, 29 April 2022 | | 540 × 360 (40 KB) | Cyali (talk | contribs) | Added source |
| 18:55, 29 April 2022 |  | 540 × 360 (33 KB) | Cyali (talk | contribs) | Uploaded own work with UploadWizard |
You cannot overwrite this file.
File usage on Commons
The following page uses this file:
File usage on other wikis
The following other wikis use this file:
- Usage on en.wikipedia.org
- Usage on it.wikipedia.org