File:Timeline of US overdose deaths involving heroin, by other opioid involvement.jpg
(Redirected from File:US timeline. Heroin deaths.jpg)

Size of this preview: 800 × 600 pixels. Other resolutions: 320 × 240 pixels | 640 × 480 pixels | 1,024 × 768 pixels | 1,200 × 900 pixels.
Original file (1,200 × 900 pixels, file size: 188 KB, MIME type: image/jpeg)
Captions
Captions
Add a one-line explanation of what this file represents

|
File:US timeline. Heroin deaths.svg is a vector version of this file. It should be used in place of this JPG file when not inferior.
File:Timeline of US overdose deaths involving heroin, by other opioid involvement.jpg → File:US timeline. Heroin deaths.svg
For more information, see Help:SVG. |
 |
Summary[edit]
| Description |
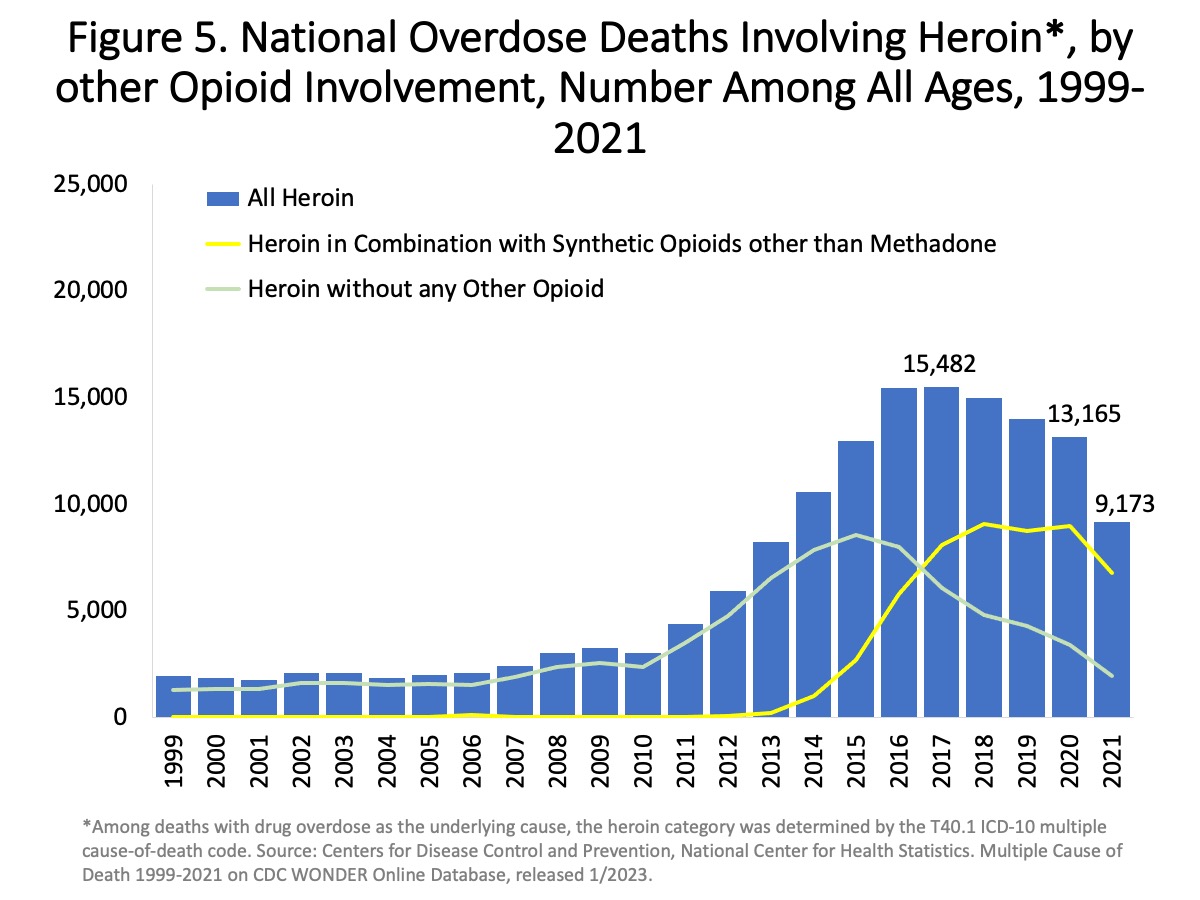
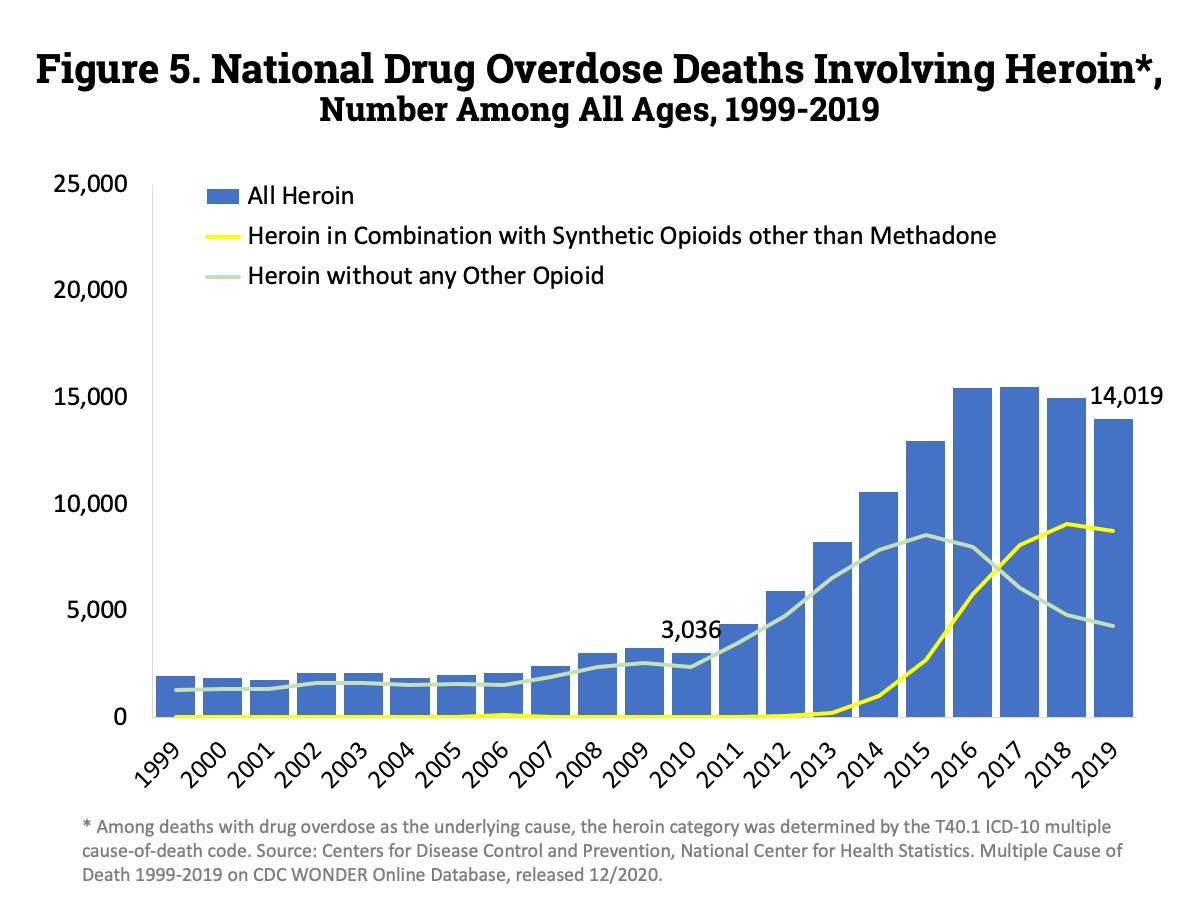
English: "Figure 5. National Overdose Deaths Involving Heroin, by Other Opioid Involvement—Number Among All Ages, 1999-2021. The figure above is a bar and line graph showing the total number of U.S. overdose deaths involving heroin from 1999 to 2021. Drug overdose deaths involving heroin rose from 1,960 in 1999 to 15,482 in 2017 before trending down to 13,165 deaths in 2020 and 9,173 deaths in 2021. The bars are overlaid by lines showing the number of deaths involving heroin in combination with synthetic opioids other than methadone (primarily fentanyl) or without any other opioid from 1999 to 2021 (Source: CDC WONDER)." |
| Date | - date of first upload to the Commons. See file history for dates of later uploads. |
| Source | Overdose Death Rates. By National Institute on Drug Abuse (NIDA). 1999-2021 chart. 1999-2019 chart. 2002-2017 chart. 2002-2015 chart. 2001-2014 chart. |
| Author | National Institute on Drug Abuse. Some versions of the chart were cropped, and have had "USA" added to them. Freeware IrfanView, etc. can be used. See Commons:Convert tables and charts to wiki code or image files, and the section about adding text to chart images. |
Licensing[edit]
This image is a work of the National Institutes of Health, part of the United States Department of Health and Human Services, taken or made as part of an employee's official duties. As a work of the U.S. federal government, the image is in the public domain.
 |
||
| This file has been identified as being free of known restrictions under copyright law, including all related and neighboring rights. | ||
File history
Click on a date/time to view the file as it appeared at that time.
| Date/Time | Thumbnail | Dimensions | User | Comment | |
|---|---|---|---|---|---|
| current | 00:00, 22 July 2023 | | 1,200 × 900 (188 KB) | Timeshifter (talk | contribs) | Latest |
| 08:52, 31 August 2021 |  | 1,150 × 865 (184 KB) | Timeshifter (talk | contribs) | Latest chart from source. | |
| 15:23, 6 September 2018 |  | 810 × 589 (94 KB) | Timeshifter (talk | contribs) | newer chart | |
| 10:51, 27 March 2017 |  | 794 × 636 (91 KB) | Timeshifter (talk | contribs) | 2015 column. | |
| 11:11, 1 January 2016 |  | 791 × 586 (84 KB) | Timeshifter (talk | contribs) | User created page with UploadWizard |
You cannot overwrite this file.
File usage on Commons
The following 3 pages use this file:
File usage on other wikis
The following other wikis use this file:
- Usage on ar.wikipedia.org
- Usage on en.wikipedia.org
- Usage on es.wikipedia.org
- Usage on hy.wikipedia.org
- Usage on ja.wikipedia.org
- Usage on sr.wikipedia.org
- Usage on vi.wikipedia.org
- Usage on zh.wikipedia.org