File:US solar break-even cost.png
Jump to navigation
Jump to search

Size of this preview: 800 × 519 pixels. Other resolutions: 320 × 208 pixels | 640 × 415 pixels | 1,024 × 664 pixels | 1,280 × 830 pixels | 1,850 × 1,200 pixels.
Original file (1,850 × 1,200 pixels, file size: 65 KB, MIME type: image/png)
Captions
Captions
Add a one-line explanation of what this file represents
Summary[edit]
| Description |
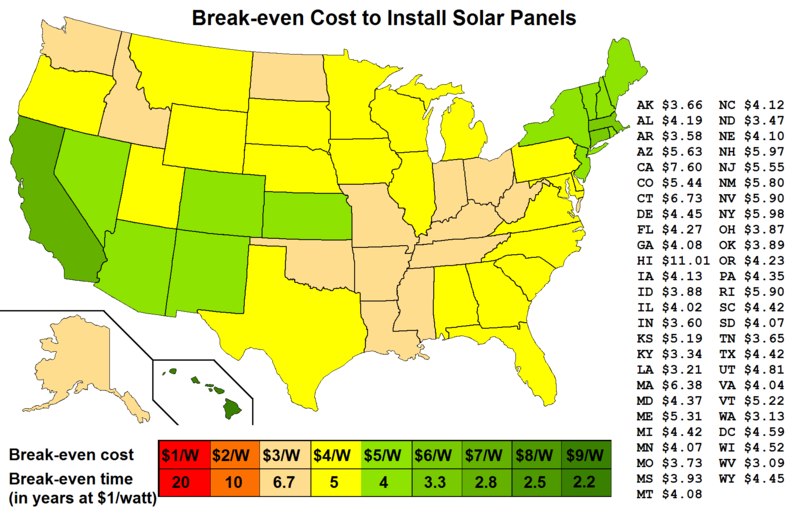
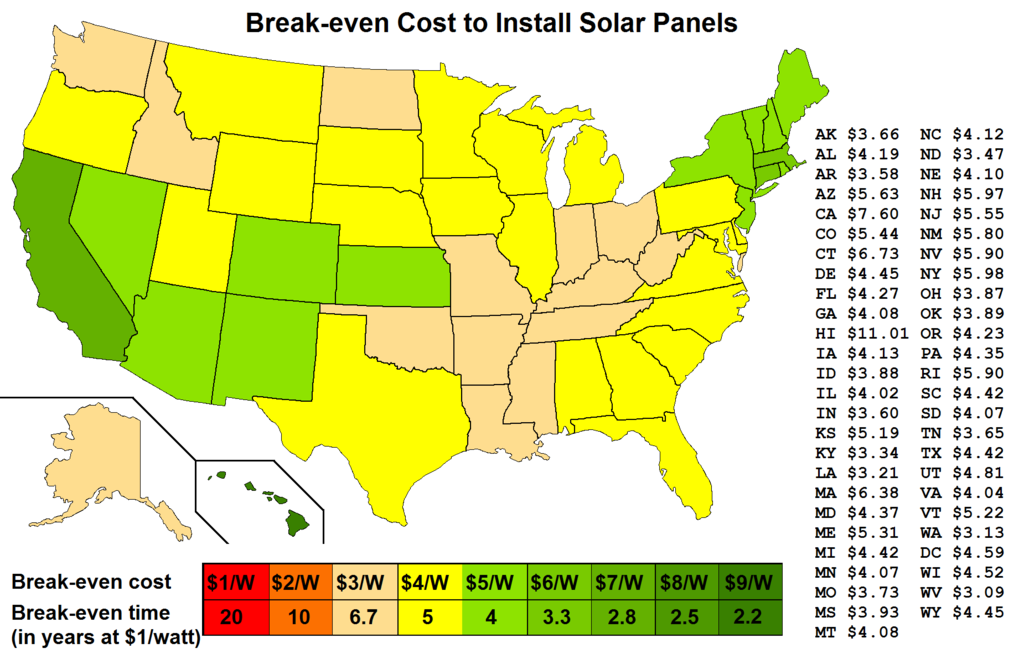
English: The break-even cost to install solar panels is a function of the amount of insolation, the cost of electricity, and the service life, assumed here to be 20 years. The map shows the break-even cost based on the insolation, in KWh/m²/day, or sun hours per day, times 365 days/year times 20 years times the average cost per kWh in each state. The numbers are an approximation, since cost and insolation vary within each state. Electricity cost is average residential for 2015 from the EIA.[1] The break-even cost is increased if electricity prices increase over time, or if any incentives are available, and reduced if maintenance and finance costs are included. For example, Nellis AFB is obtaining solar electricity for 2.2 ¢/kWh, from solar panels installed at a cost of $5.49/Watt, due to the sale of the Renewable Energy Credits. With the increases in electricity prices there are no states where solar is not cost effective, when the 30% tax credit is included.
The map is essentially a combination of  and and  . . |
| Date | |
| Source | Own work |
| Author | Delphi234 |
Licensing[edit]
| I, the copyright holder of this work, release this work into the public domain. This applies worldwide. In some countries this may not be legally possible; if so: I grant anyone the right to use this work for any purpose, without any conditions, unless such conditions are required by law. |
File history
Click on a date/time to view the file as it appeared at that time.
| Date/Time | Thumbnail | Dimensions | User | Comment | |
|---|---|---|---|---|---|
| current | 17:35, 2 August 2016 | | 1,850 × 1,200 (65 KB) | Kopiersperre (talk | contribs) | optipng |
| 15:49, 2 August 2016 |  | 1,850 × 1,200 (142 KB) | Delphi234 (talk | contribs) | update using 2015 residential electricity cost | |
| 06:17, 25 June 2015 |  | 1,850 × 1,200 (137 KB) | Delphi234 (talk | contribs) | update using 2014 residential electricity cost | |
| 00:46, 13 July 2014 |  | 1,850 × 1,200 (133 KB) | Delphi234 (talk | contribs) | update using 2013 residential electricity cost | |
| 00:45, 13 July 2014 |  | 1,850 × 1,200 (133 KB) | Delphi234 (talk | contribs) | update using 2010 residential electricity cost | |
| 00:44, 13 July 2014 |  | 1,850 × 1,200 (133 KB) | Delphi234 (talk | contribs) | update using 2009 residential electricity cost | |
| 07:26, 4 March 2013 |  | 1,850 × 1,200 (180 KB) | Delphi234 (talk | contribs) | update using 2012 residential electricity cost | |
| 07:10, 4 March 2013 |  | 1,850 × 1,200 (184 KB) | Delphi234 (talk | contribs) | Reverted to version as of 23:01, 3 July 2012 | |
| 07:09, 4 March 2013 |  | 1,850 × 1,200 (181 KB) | Delphi234 (talk | contribs) | update with 2012 electricity cost | |
| 23:01, 3 July 2012 |  | 1,850 × 1,200 (184 KB) | Delphi234 (talk | contribs) | Update using 2011 average residential electricity cost. |
You cannot overwrite this file.
File usage on Commons
There are no pages that use this file.