File:UK abortion by gestational age 2004 histogram.svg

Original file (SVG file, nominally 450 × 380 pixels, file size: 16 KB)
Captions
Captions
| Description |
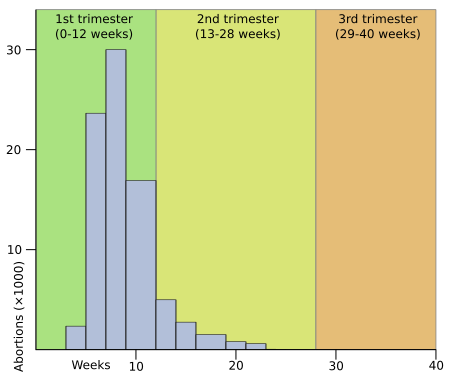
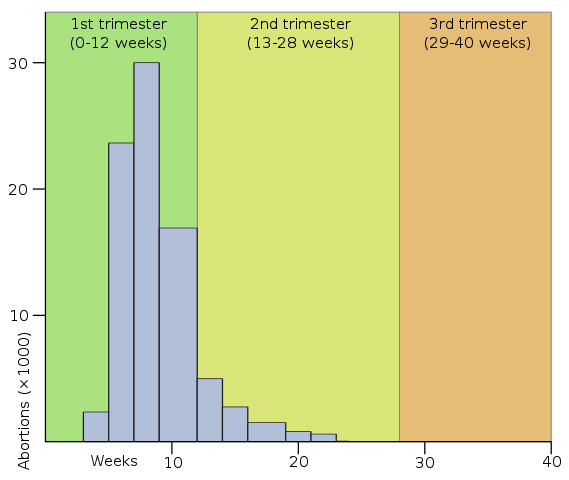
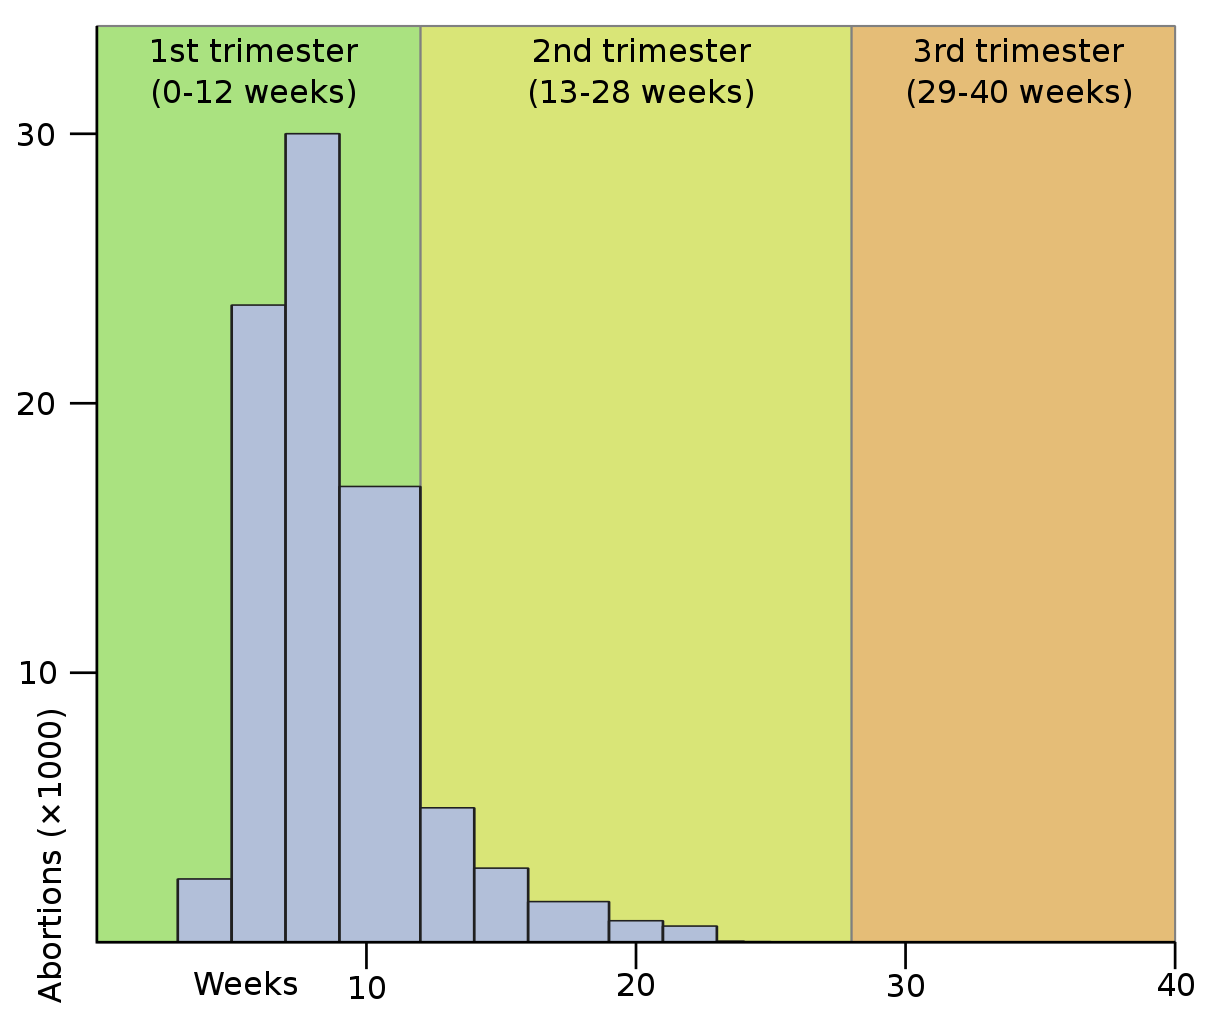
Histogram of abortions by gestational age for England and Wales in 2004. Horizontal axis is weeks and vertical axis is thousands of abortions. Data (reproduced below) is taken from Government Statistical Service for the Department of Health. (2005-07-27). Statistical Bulletin - Abortion Statistics, England and Wales: 2004. Table 5 - Legal abortions: gestation weeks by purchaser, 2004, England and Wales, residents (page 13 of the PDF) Meant to replace File:UKAbortionbyGestationalAgeChart2004.png. A pie chart is a poor way to show this kind of information, and a histogram is better suited to bins of variable width, as presented in the data set. Colors and trimester boundaries are the same as w:Image:Abortionmethods.png for consistency. I did draw the data from 4 weeks out until 40 weeks, but the rectangles are so short they can't be seen. |
||
| Date | |||
| Source |
|
||
| Author | Omegatron | ||
| Permission (Reusing this file) |
I, the copyright holder of this work, hereby publish it under the following licenses: This file is licensed under the Creative Commons Attribution-Share Alike 3.0 Unported, 2.5 Generic, 2.0 Generic and 1.0 Generic license.
You may select the license of your choice. |
||
| Other versions |
|


Data[edit]
| Gestation weeks |
Abortions | /weeks in bin |
|---|---|---|
| 4-5 | 4688 | 2344 |
| 6-7 | 47230 | 23615 |
| 8-9 | 59934 | 29967 |
| 10-12 | 50677 | 16892 |
| 13-14 | 9962 | 4981 |
| 15-16 | 5492 | 2746 |
| 17-19 | 4518 | 1506 |
| 20-21 | 1592 | 796 |
| 22-23 | 1198 | 599 |
| 24 | 41 | 41 |
| 25 | 21 | 21 |
| 26-27 | 20 | 10 |
| 28-31 | 24 | 6 |
| 32+ | 18 | 2 |
| Total | 185415 |
The average gestation for an abortion is thus:
[(4.5)(4688)+(6.5)(47230)+(8.5)(59934)+(11)(50677)+(13.5)(9962)+(15.5)(5492)+(18)(4518)+(20.5)(1592)+(22.5)(1198)+(24)(41)+(25)(21)+(26.5)(20)+(29.5)(24)+(32)(18)]/185415=
[21096+306995+509439+557447+134487+85126+81324+32636+20366+984+525+530+708+576]/185415=
1752239/185415=
9.45 weeks.
File history
Click on a date/time to view the file as it appeared at that time.
| Date/Time | Thumbnail | Dimensions | User | Comment | |
|---|---|---|---|---|---|
| current | 00:08, 4 August 2007 | | 450 × 380 (16 KB) | Omegatron (talk | contribs) | add labels for axes |
| 03:11, 1 August 2007 |  | 450 × 380 (16 KB) | Omegatron (talk | contribs) | less perfect version with Inkscape scaling to a more normal aspect, added axes, etc. | |
| 03:10, 1 August 2007 |  | 500 × 500 (8 KB) | Omegatron (talk | contribs) | Raw data with 1 px horiz. = week and 500px vert. = 30,000 |
You cannot overwrite this file.
File usage on Commons
The following 7 pages use this file:
- User:Omegatron/Gallery
- File:UKAbortionbyGestationalAgeChart2004.png
- File:UK abortion by gestational age 2004 histogram.svg
- File:UK abortion by gestational age 2019 histogram.svg
- File:US abortion by gestational age 2002 histogram.svg
- File:US abortion by gestational age 2004 histogram.svg
- File:US abortion by gestational age 2016 histogram.svg
File usage on other wikis
The following other wikis use this file:
- Usage on en.wikipedia.org
- Usage on fi.wikipedia.org