File:Thermoluminescent Dosimeter Energy Diagram.svg
Jump to navigation
Jump to search

Size of this PNG preview of this SVG file: 581 × 226 pixels. Other resolutions: 320 × 124 pixels | 640 × 249 pixels | 1,024 × 398 pixels | 1,280 × 498 pixels | 2,560 × 996 pixels.
Original file (SVG file, nominally 581 × 226 pixels, file size: 58 KB)
Captions
Captions
Add a one-line explanation of what this file represents
Summary[edit]
| Description |
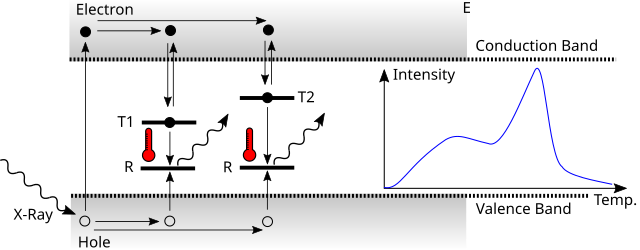
English: Band model diagram of a thermoluminescent radiation detector. Deep trap states and metastable states have been omitted. The inset plot shows a "glow curve" that is acquired during detector readout.
Русский: Схема термолюминесцентной дозиметрии. Показана зонная диаграмма, уровни глубоких ловушек и график термолюминесценции при нагреве при измерении поглощённой дозы. |
| Date | |
| Source | Own work |
| Author | Michael Weinold |
| Other versions |
|
Licensing[edit]
I, the copyright holder of this work, hereby publish it under the following license:
This file is licensed under the Creative Commons Attribution-Share Alike 4.0 International license.
- You are free:
- to share – to copy, distribute and transmit the work
- to remix – to adapt the work
- Under the following conditions:
- attribution – You must give appropriate credit, provide a link to the license, and indicate if changes were made. You may do so in any reasonable manner, but not in any way that suggests the licensor endorses you or your use.
- share alike – If you remix, transform, or build upon the material, you must distribute your contributions under the same or compatible license as the original.
File history
Click on a date/time to view the file as it appeared at that time.
| Date/Time | Thumbnail | Dimensions | User | Comment | |
|---|---|---|---|---|---|
| current | 13:30, 26 May 2018 | 581 × 226 (58 KB) | Michael Weinold (talk | contribs) | User created page with UploadWizard |
You cannot overwrite this file.
File usage on Commons
The following 2 pages use this file: