File:Strahlenexposition DACHL.png
From Wikimedia Commons, the free media repository
Jump to navigation
Jump to search

Size of this preview: 700 × 600 pixels. Other resolutions: 280 × 240 pixels | 560 × 480 pixels | 896 × 768 pixels | 1,195 × 1,024 pixels | 2,390 × 2,048 pixels | 2,772 × 2,375 pixels.
Original file (2,772 × 2,375 pixels, file size: 4.52 MB, MIME type: image/png)
File information
Structured data
Captions
Captions
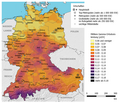
Map of mean annual radiation exposure (terrestrial gamma) in the (partial) German-speaking countries of central Europe and the Alpine realm
Karte der mittleren jährlichen Strahlenexposition (terrestrische Gammastrahlung) in den (partiell) deutschsprachigen Ländern Mitteleuropas und des Alpenraumes
Summary[edit]
| DescriptionStrahlenexposition DACHL.png |
Deutsch: Karte der mittleren jährlichen Strahlenexposition (terrestrische Gammastrahlung) in den (partiell) deutschsprachigen Ländern Mitteleuropas und des Alpenraumes („DACHL“), basierend auf Daten aus den Jahren 2016 (Deutschland, Schweiz) und 2017/2018 (Österreich); für Details siehe unten.
English: Map of mean annual radiation exposure (terrestrial gamma) in the (partial) German-speaking countries of central Europe and the Alpine realm (“DACHL”), based on data from 2016 (Germany, Switzerland) and 2017/2018 (Austria); for details see below. |
| Date | |
| Source | Own work (for software used, methods, and raw data sources see below) |
| Author | Gretarsson |
Licensing[edit]
I, the copyright holder of this work, hereby publish it under the following license:
This file is licensed under the Creative Commons Attribution-Share Alike 3.0 Unported license.
- You are free:
- to share – to copy, distribute and transmit the work
- to remix – to adapt the work
- Under the following conditions:
- attribution – You must give appropriate credit, provide a link to the license, and indicate if changes were made. You may do so in any reasonable manner, but not in any way that suggests the licensor endorses you or your use.
- share alike – If you remix, transform, or build upon the material, you must distribute your contributions under the same or compatible license as the original.
Sources and methods[edit]
Deutsch: Die für die Erstellung der Karte benutzen Rohdaten setzen sich zusammen aus Zahlen
- des deutschen Bundesamtes für Strahlenschutz (BFS) für das Jahr 2016 (1750 Messpunkte; Jahreswerte basierend auf im Schnitt 357 Tagesmittelwerten pro Messpunkt[1]),
- des schweizerischen Bundesamtes für Gesundheit (BAG) für das Jahr 2016 (68 Messpunkte[2])
- und des österreichischen Bundesministeriums für Nachhaltigkeit und Tourismus (BMNT) für den Zeitraum November 2017 bis Oktober 2018 (110 Messpunkte; Jahreswerte basierend auf im Schnitt rund 8750 Stundenmittelwerten pro Messpunkt[3]).
English: The data set used for the generation of the map is composed of counts
- from the German Bundesamt für Strahlenschutz (BFS) for the year 2016 (1750 monitoring sites; annual values are based on about 357 daily average values per monitoring site[1]),
- from the Swiss Bundesamt für Gesundheit (BAG) for the year 2016 (68 monitoring sites[2]),
- and from the Austrian Bundesministerium für Nachhaltigkeit und Tourismus (BMNT) for the period between October 2017 and November 2018 (110 monitoring sites; annual values are based on about 8750 hourly average values per monitoring site[3]).
References[edit]
- ↑ a b Download URL: https://odlinfo.bfs.de/downloads/ODL_Tagesmittelwerte_2016.dat.zip
- ↑ a b Bundesamt für Gesundheit (ed.): Umweltradioaktivität und Strahlendosen in der Schweiz 2016. BAG, Direktionsbereich Verbraucherschutz, Abteilung Strahlenschutz, Umweltradioaktivität, Bern 2017 (PDF), p. 48
- ↑ a b copied & pasted from https://www.bmnt.gv.at/umwelt/strahlen-atom/strahlen-warn-system/messwerte_aktuell.html (note that only data from the past 7 months are available for each monitoring site)
- ↑ a b copied & pasted from http://eurdepweb.jrc.ec.europa.eu/EurdepMap/Default.aspx (note that only data from the past 4 months are availabe for each monitoring site)
- ↑ a b https://earthexplorer.usgs.gov/
- ↑ a b created by Open Street Map contributors, 2018, licensed under the Open Database 1.0 License, downloaded as shape files at Geofabrik/Europe and extracted from OSM as shape files via OSM Admin Boundaries Map
File history
Click on a date/time to view the file as it appeared at that time.
| Date/Time | Thumbnail | Dimensions | User | Comment | |
|---|---|---|---|---|---|
| current | 01:09, 5 January 2019 |  | 2,772 × 2,375 (4.52 MB) | Gretarsson (talk | contribs) | added missing label for city of Essen, corrected unit abbreviation µS/h to µSv/h |
| 16:19, 18 December 2018 |  | 2,772 × 2,375 (4.52 MB) | Gretarsson (talk | contribs) | {{Information |description ={{de|1=Karte mit der mittleren jährlichen Strahlenexposition in den (partiell) deutschsprachigen Ländern Mitteleuropas und des Alpenraumes, basierend auf Daten aus den Jahren 2016 (Deutschland, Schweiz) und 2017/2018 (Österreich). }} {{en|1=Map of mean annual radiation exposure (T-gamma) in the (partial) German-speaking countries of central Europe and the Alpine realm, based on data from 2016 (Germany, Switzerland) and 2017/2018 (Austria).}} |date =2018-... |
You cannot overwrite this file.
File usage on Commons
The following page uses this file:
File usage on other wikis
The following other wikis use this file:
- Usage on de.wikipedia.org
Metadata
This file contains additional information such as Exif metadata which may have been added by the digital camera, scanner, or software program used to create or digitize it. If the file has been modified from its original state, some details such as the timestamp may not fully reflect those of the original file. The timestamp is only as accurate as the clock in the camera, and it may be completely wrong.
| Horizontal resolution | 117.71 dpc |
|---|---|
| Vertical resolution | 117.71 dpc |