File:Statistiques IPH 2000.png
Jump to navigation
Jump to search
No higher resolution available.
Statistiques_IPH_2000.png (610 × 461 pixels, file size: 4 KB, MIME type: image/png)
Captions
Captions
Add a one-line explanation of what this file represents

|
This math image could be re-created using vector graphics as an SVG file. This has several advantages; see Commons:Media for cleanup for more information. If an SVG form of this image is available, please upload it and afterwards replace this template with
{{vector version available|new image name}}.
It is recommended to name the SVG file “Statistiques IPH 2000.svg”—then the template Vector version available (or Vva) does not need the new image name parameter. |
Summary[edit]
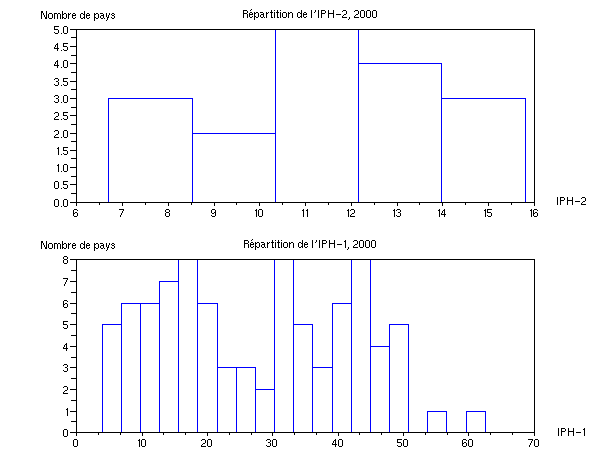
Répartition statistiques des indicateurs de pauvreté humaine (IPH) en 2000.
Statistical distribution of the human poverty indicators (HPI) in 2000.
| Indicateur Indicator |
Valeur Value |
Commentaire Comment |
|---|---|---|
| Moyenne Average |
11,3 | |
| Médiane Median |
11,2 | La moitié des pays ont un IPH-2 supérieur à 11,2, l'autre moitié un IPH-2 inférieur Half of the countries have an HPI-2 greater than 11.2, half lower HPI-2 |
| 1er décile 1st decile |
7,5 | Les 2 pays les plus riches ont un IPH-2 inférieur ou égal à 7.5 The 2 richest countries have a HPI-2 lower or equal than 7.5 |
| 9e décile 9th decile |
15,3 | Les 2 pays les plus pauvres ont un IPH-2 supérieur ou égal à 15,3 The 2 poorest countries have a HPI-2 greater or equal than 15.3 |
C'est une distribution unimodale dont le mode est environ 11,5.
This is an unimodal distribution, with a mode of about 11.5.
| Indicateur Indicator |
Valeur Value |
Commentaire Comment |
|---|---|---|
| Moyenne Average |
25,7 | |
| Médiane Median |
23,4 | La moitié des pays ont un IPH-1 supérieur à 23,4, l'autre moitié un IPH-1 inférieur Half of the countries have an HPI-2 greater than 23.4, half a lower HPI-1 |
| 1er décile 1st decile |
8,5 | Les 9 pays les plus riches ont un IPH-1 inférieur ou égal à 8,5 The 9 richest countries have a HPI-1 lower or equal than 8.5 |
| 9e décile 9th decile |
46,8 | Les 9 pays les plus pauvres ont un IPH-1 supérieur ou égal à 46,8 The 9 poorest countries have a HPI-1 greater or equal than 46.8 |
C'est une distribution trimodale dont les mode sont environ 17, 32 et 43.
This is an trimodal distribution, with modes of about 17, 32 and 43.
Auteur/author : Christophe Dang Ngoc Chan (cdang)
Réalisé avec/made with : Scilab
clear;clf;

IPH1=[3.9, 4, 4.1, 4.1, 6.5, 7.9, 8.2, 8.4, 8.5, 8.9,...
9.4, 9.9, 10.2, 11, 11.3, 11.4, 12.2, 12.7, 12.8,...
13.2, 14, 14, 14.6, 14.9, 15.8, 16.1, 16.2, 16.3,...
16.9, 17, 17.6, 18.1, 18.8, 19.3, 19.4, 20.5, 20.8,...
21.3, 23.4, 23.5, 24.4, 25.7, 27.1, 27.2, 28.7, 30,...
30.7, 31.2, 31.9, 31.9, 32.1, 32.7, 32.7, 33.1, 34.3,...
34.5, 34.9, 35.8, 36.1, 36.7, 37.5, 37.9, 39.1,...
39.7, 40.0, 40.8, 41, 41.8, 42.3, 42.3, 42.4,42.5,...
42.9, 43.3, 43.4, 44.3, 45.2, 45.2, 46.8, 47.3, 47.9,...
47.9, 48.5, 49.3, 50.5, 56.5, 62.5];

IPH2=[6.7, 7.5, 8.5, 8.8, 9.5, 10.5, 10.8, 11.1, 11.2,...
11.3, 12.2, 12.3, 12.6, 12.9, 15.1, 15.3, 15.8];

subplot(2,1,1) // Pays riches

histplot(5,IPH2, style=2, normalization=%f)
xtitle('Répartition de l''IPH-2, 2000', 'IPH-2', 'Nombre de pays')

subplot(2,1,2) // Pays pauvres

histplot(20,IPH1, style=2, normalization=%f)
xtitle('Répartition de l''IPH-1, 2000', 'IPH-1', 'Nombre de pays')
Licensing[edit]

|
Permission is granted to copy, distribute and/or modify this document under the terms of the GNU Free Documentation License, Version 1.2 or any later version published by the Free Software Foundation; with no Invariant Sections, no Front-Cover Texts, and no Back-Cover Texts. A copy of the license is included in the section entitled GNU Free Documentation License. |
| This file is licensed under the Creative Commons Attribution-Share Alike 3.0 Unported license. | ||
| ||
| This licensing tag was added to this file as part of the GFDL licensing update. |
File history
Click on a date/time to view the file as it appeared at that time.
| Date/Time | Thumbnail | Dimensions | User | Comment | |
|---|---|---|---|---|---|
| current | 11:36, 15 December 2005 | | 610 × 461 (4 KB) | Cdang (talk | contribs) | Error on X-axis name |
| 11:34, 15 December 2005 |  | 610 × 461 (4 KB) | Cdang (talk | contribs) | exchange top/bottom figures | |
| 11:02, 15 December 2005 |  | 610 × 461 (4 KB) | Cdang (talk | contribs) | Répartition statistiques des indicateurs de pauvreté humaine (IPH) en 2000. ---- Statistical distribution of the human poverty indicators (HPI) in 2000. Auteur/author : Christophe Dang Ngoc Chan (cdang) Réalisé avec/made with : [http |
You cannot overwrite this file.
File usage on Commons
There are no pages that use this file.