File:Price Chart for Crude Oil.png
Jump to navigation
Jump to search

Size of this preview: 800 × 259 pixels. Other resolutions: 320 × 104 pixels | 640 × 207 pixels | 1,024 × 331 pixels | 2,768 × 896 pixels.
Original file (2,768 × 896 pixels, file size: 26 KB, MIME type: image/png)
Captions
Captions
Add a one-line explanation of what this file represents
Summary[edit]
| Description |
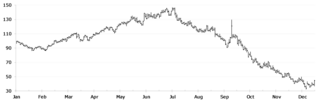
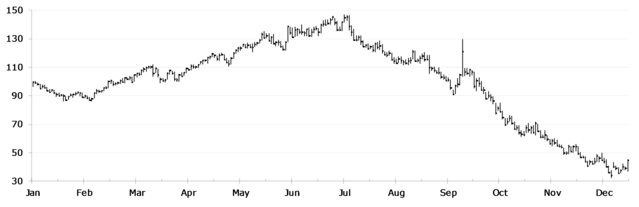
English: Price chart: As the trend strengthens, notice how the VI+ and VI− lines increasingly diverge. As the trend weakens, you will observe the two lines converging again. |
| Date | UTC |
| Source | Own work (Original text: I (Vickypedia30 (talk)) created this work entirely by myself.) |
| Author | Vickypedia30 (talk) |
Licensing[edit]
| This work has been released into the public domain by its author, Vickypedia30 at English Wikipedia. This applies worldwide. In some countries this may not be legally possible; if so: Vickypedia30 grants anyone the right to use this work for any purpose, without any conditions, unless such conditions are required by law. |
Original upload log[edit]
The original description page was here. All following user names refer to en.wikipedia.
| Date/Time | Dimensions | User | Comment |
|---|---|---|---|
| 2017-01-15 17:44 | 2768×896× (172290 bytes) | Ras67 | cropped losslessly with Jpegcrop |
| 2010-01-11 12:05 | 2847×931× (291367 bytes) | Vickypedia30 | {{Information |Description = |Source = I (~~~) created this work entirely by myself. |Date = ~~~~~ |Author = ~~~ |other_versions = }} |
File history
Click on a date/time to view the file as it appeared at that time.
| Date/Time | Thumbnail | Dimensions | User | Comment | |
|---|---|---|---|---|---|
| current | 16:55, 17 November 2017 | 2,768 × 896 (26 KB) | Ras67 (talk | contribs) | == {{int:filedesc}} == {{Information |Description={{en|1=Price chart: As the trend strengthens, notice how the VI+ and VI− lines increasingly diverge. As the trend weakens, you will observe the two lines converging again.}} |Source=I ([[:en:User:Vick... |
You cannot overwrite this file.
File usage on Commons
The following page uses this file:
File usage on other wikis
The following other wikis use this file:
- Usage on en.wikipedia.org
- Usage on hi.wikipedia.org