File:Pre-gastrulation-cell-movements-are-impaired-by-ROCK-inhibition-A-D-F-I-Dorsal-views a.jpg
Jump to navigation
Jump to search
Size of this preview: 572 × 600 pixels. Other resolutions: 229 × 240 pixels | 458 × 480 pixels | 732 × 768 pixels | 1,233 × 1,293 pixels.
Original file (1,233 × 1,293 pixels, file size: 1.14 MB, MIME type: image/jpeg)
Captions
Captions
Add a one-line explanation of what this file represents
Summary[edit]
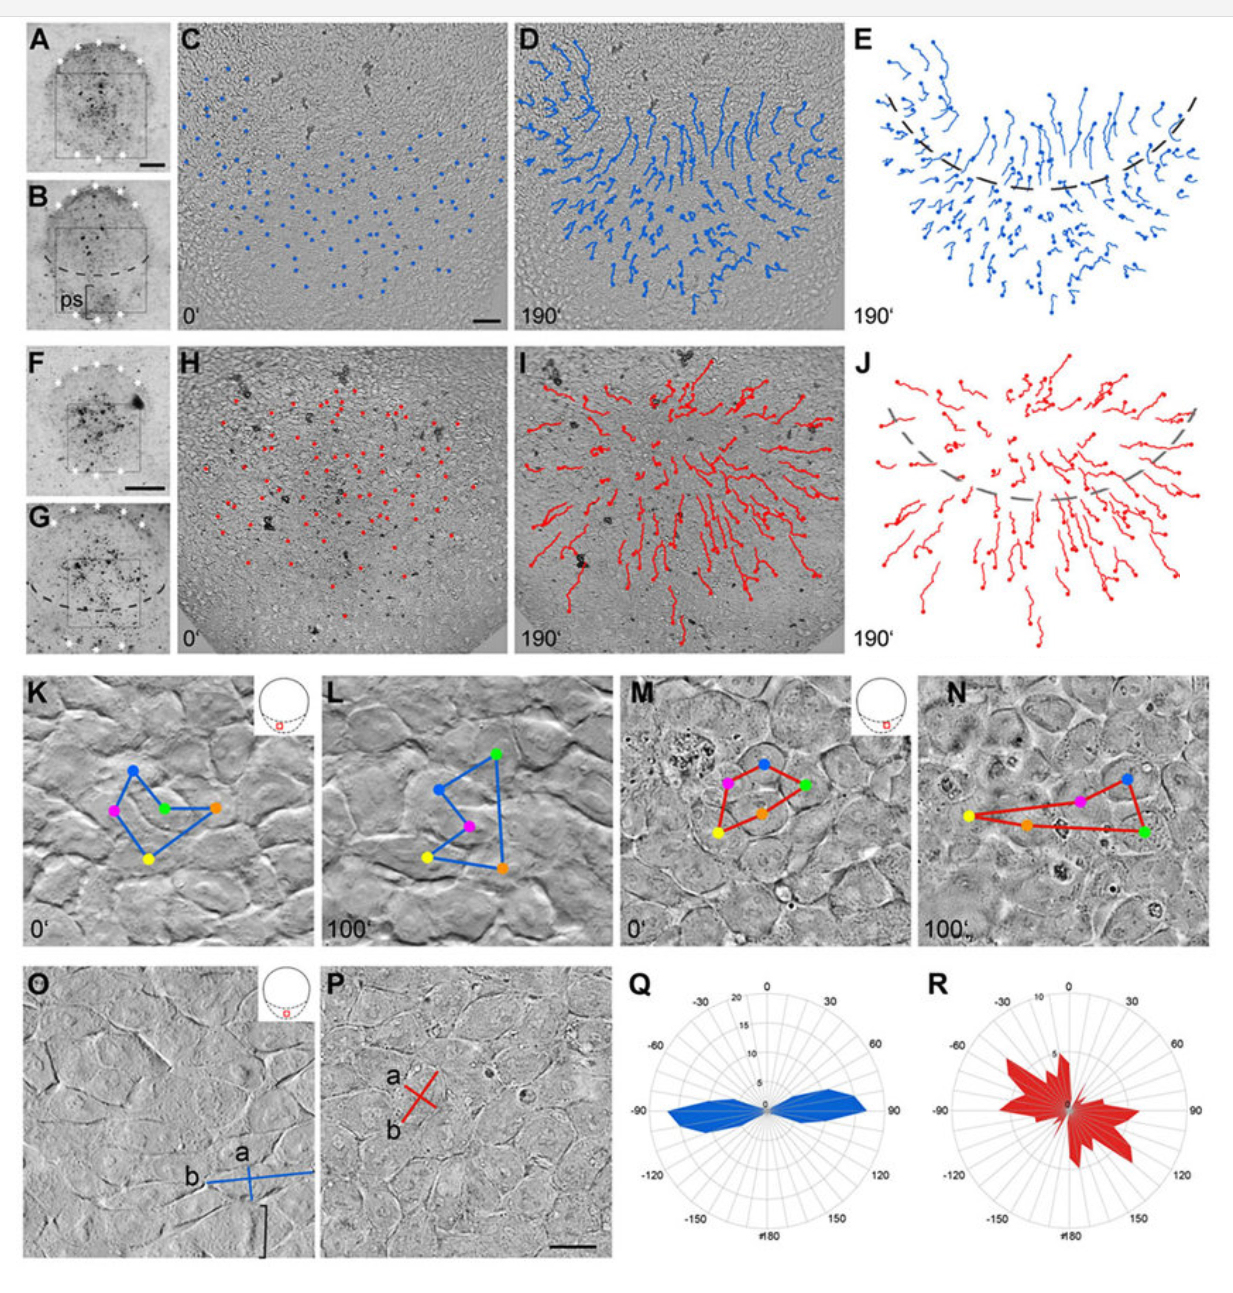
| Description | Fig. 1. Pre-gastrulation cell movements are impaired by ROCK inhibition. (A-D,F-I) Dorsal views of control (A-D) and 40 µM ROCK-inhibited (F-I) rabbit embryonic discs taken at the beginning (A,C,F,H) and the end (B,D,G,I) of the timelapse movie (supplementary material Movies 1,2). Asterisks mark embryonic disc borders. (E,J) Paths of the traced cells relative to the posterior gastrula extension (PGE) area (anterior border marked by dashed lines). (K,L) Processional cell movement in control embryo (see the cell marked in red passing between the cells marked in blue and yellow). (M,N) Cell intercalation in treated embryo (see the cell marked in red squeezed between the cells marked in green and orange in M,N). (O,P) High magnification of DIC recordings, showing cell form and protrusions defined by the quotient of the long cell axis (b) divided by the short cell axis (a) in control (O) and treated (P) embryo. Square bracket in O marks metaphase plate. (Q,R) Quantitative analysis of the orientation of the longest cell protrusions related to the anteriorposterior (AP) axis (0°±180°) in control (Q) and in treated (R) embryos using measurements of the angles between the longest cell axis and the AP axis. Radial graduation shows the number of cells that fall within a specific angular region and orbital graduation shows the angles. Scale bars: 250 µm in A for A,B; 50 µm in C for C-E,H-J; 175 µm in F for F,G; 5 µm in P for K-P. |
| Date | |
| Source | https://journals.biologists.com/dev/article/142/1/92/46970/Rho-kinase-activity-controls-directional-cell Rho kinase activity controls directional cell movements during primitive streak formation in the rabbit embryo. Development. 2015 Jan 1;142(1):92-8. doi: 10.1242/dev.111583. PMID: 25516971; PMCID: PMC4299133. |
| Author | Stankova V, Tsikolia N, Viebahn C. |

|
This file, which was originally posted to an external website, has not yet been reviewed by an administrator or reviewer to confirm that the above license is valid. See Category:License review needed for further instructions.
|
© 2015. Published by The Company of Biologists Ltd This is an Open Access article distributed under the terms of the Creative Commons Attribution License (https://creativecommons.org/licenses/by/3.0), which permits unrestricted use, distribution and reproduction in any medium provided that the original work is properly attributed.
Licensing[edit]
This file is licensed under the Creative Commons Attribution 3.0 Unported license.
- You are free:
- to share – to copy, distribute and transmit the work
- to remix – to adapt the work
- Under the following conditions:
- attribution – You must give appropriate credit, provide a link to the license, and indicate if changes were made. You may do so in any reasonable manner, but not in any way that suggests the licensor endorses you or your use.
File history
Click on a date/time to view the file as it appeared at that time.
| Date/Time | Thumbnail | Dimensions | User | Comment | |
|---|---|---|---|---|---|
| current | 13:59, 28 April 2024 | | 1,233 × 1,293 (1.14 MB) | Rasbak (talk | contribs) | {{Information |description=Fig. 1. Pre-gastrulation cell movements are impaired by ROCK inhibition. (A-D,F-I) Dorsal views of control (A-D) and 40 µM ROCK-inhibited (F-I) rabbit embryonic discs taken at the beginning (A,C,F,H) and the end (B,D,G,I) of the timelapse movie (supplementary material Movies 1,2). Asterisks mark embryonic disc borders. (E,J) Paths of the traced cells relative to the posterior gastrula extension (PGE) area (anterior border marked by dashed lines). (K,L) Processional... |
You cannot overwrite this file.
File usage on Commons
There are no pages that use this file.