File:Mannfjöldaþróun 2002-2012.png
Jump to navigation
Jump to search

Size of this preview: 800 × 589 pixels. Other resolutions: 320 × 236 pixels | 640 × 471 pixels | 1,024 × 754 pixels | 1,200 × 884 pixels.
Original file (1,200 × 884 pixels, file size: 204 KB, MIME type: image/png)
Captions
Captions
Add a one-line explanation of what this file represents
Summary[edit]
| Description |
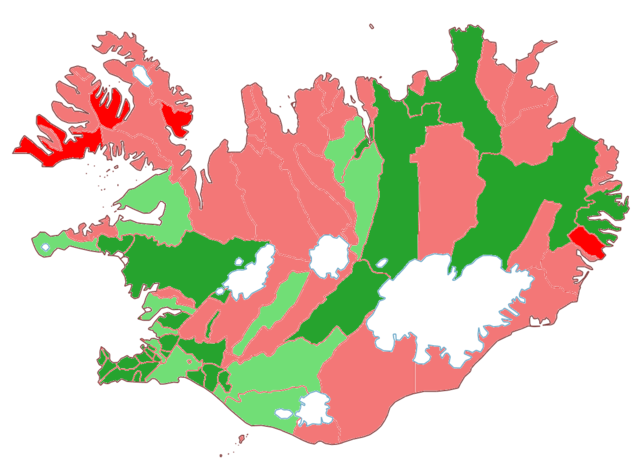
English: This map shows the changes in population of the municipalities of Iceland in the ten year period 2002-2012. The dark red municipalities have lost over 20% of their population in this period while the lighter red have experienced less severe depopulation. The green municipalities experienced a growth in population, the growth was lower than the total growth of the nation in the period (11.58%) in the light green ones and higher than the national rate in the dark green ones. |
| Date | |
| Source | Own work |
| Author | Akigka |
Based on the file Ísland sveitarfélagamörk.png by User:Bjarki S
Licensing[edit]
I, the copyright holder of this work, hereby publish it under the following license:
This file is licensed under the Creative Commons Attribution-Share Alike 3.0 Unported license.
- You are free:
- to share – to copy, distribute and transmit the work
- to remix – to adapt the work
- Under the following conditions:
- attribution – You must give appropriate credit, provide a link to the license, and indicate if changes were made. You may do so in any reasonable manner, but not in any way that suggests the licensor endorses you or your use.
- share alike – If you remix, transform, or build upon the material, you must distribute your contributions under the same or compatible license as the original.
File history
Click on a date/time to view the file as it appeared at that time.
| Date/Time | Thumbnail | Dimensions | User | Comment | |
|---|---|---|---|---|---|
| current | 12:24, 27 March 2013 | | 1,200 × 884 (204 KB) | Akigka (talk | contribs) | User created page with UploadWizard |
You cannot overwrite this file.
File usage on Commons
There are no pages that use this file.