File:Land vs Ocean Temperature.svg
Jump to navigation
Jump to search

Size of this PNG preview of this SVG file: 800 × 579 pixels. Other resolutions: 320 × 232 pixels | 640 × 463 pixels | 1,024 × 741 pixels | 1,280 × 927 pixels | 2,560 × 1,853 pixels | 960 × 695 pixels.
Original file (SVG file, nominally 960 × 695 pixels, file size: 18 KB)
Captions
Captions
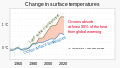
Land surface temperatures have increased faster than ocean temperatures as the ocean absorbs at least 90% of excess heat in the atmosphere.
Summary[edit]
| Description |
English: Chart with data from NASA showing how land and sea surface air temperatures have changed up through 2022 relative to the 1951-1980 average. The ocean is absorbing over 90% of excess heat trapped in the atmosphere, greatly limiting global temperature change but contributing to sea level rise, coral bleaching, and other adverse effects.
Link to NASA GISS data access page and direct link to chart data, before being adjusted to be against IPCC baseline temp instead of mid century average. |
| Date | |
| Source | Own work |
| Author | Efbrazil |
| Other versions |
|


Related file(s)[edit]
-
 20230706 Excess heat absorbed through ocean's surface - global warming.svg

Licensing[edit]
I, the copyright holder of this work, hereby publish it under the following license:
This file is licensed under the Creative Commons Attribution-Share Alike 4.0 International license.
- You are free:
- to share – to copy, distribute and transmit the work
- to remix – to adapt the work
- Under the following conditions:
- attribution – You must give appropriate credit, provide a link to the license, and indicate if changes were made. You may do so in any reasonable manner, but not in any way that suggests the licensor endorses you or your use.
- share alike – If you remix, transform, or build upon the material, you must distribute your contributions under the same or compatible license as the original.
File history
Click on a date/time to view the file as it appeared at that time.
| Date/Time | Thumbnail | Dimensions | User | Comment | |
|---|---|---|---|---|---|
| current | 23:24, 3 July 2023 | | 960 × 695 (18 KB) | Efbrazil (talk | contribs) | Updated for data up through 2022, and culled data older than 1950 (suspect accuracy, irrelevant to baseline) |
| 18:07, 22 February 2021 |  | 960 × 685 (20 KB) | Efbrazil (talk | contribs) | change vs --> change from | |
| 13:43, 17 January 2021 |  | 960 × 685 (20 KB) | Efbrazil (talk | contribs) | Cropping / position fix to dates at bottom of chart | |
| 13:31, 17 January 2021 |  | 960 × 681 (20 KB) | Efbrazil (talk | contribs) | Updated for 2020 data | |
| 21:35, 21 August 2020 |  | 960 × 681 (21 KB) | Efbrazil (talk | contribs) | Fixed location of background, also fixed x axis tick marks to be standard | |
| 00:00, 1 August 2020 |  | 960 × 696 (19 KB) | Efbrazil (talk | contribs) | Added fahrenheit to simplify for US audience | |
| 15:55, 13 May 2020 |  | 960 × 643 (15 KB) | Nyq (talk | contribs) | Decapitalized common nouns | |
| 22:11, 3 April 2020 |  | 960 × 643 (15 KB) | Efbrazil (talk | contribs) | Changing 92% to "over 90%" as per conflicting sources (some say over 93%). Also darkened up trace lines a bit. | |
| 22:19, 3 March 2020 |  | 960 × 643 (15 KB) | Efbrazil (talk | contribs) | Improved title precision | |
| 21:14, 2 March 2020 |  | 960 × 643 (15 KB) | Efbrazil (talk | contribs) | Fixing to better match the chart above this one. Also right aligned title text. |
You cannot overwrite this file.
File usage on Commons
The following 5 pages use this file:
File usage on other wikis
The following other wikis use this file:
- Usage on az.wikipedia.org
- Usage on bn.wikipedia.org
- Usage on cs.wikipedia.org
- Usage on en.wikipedia.org
- Usage on es.wikipedia.org
- Usage on ha.wikipedia.org
- Usage on he.wikipedia.org
- Usage on id.wikipedia.org
- Usage on it.wikipedia.org
- Usage on ko.wikipedia.org
- 해수의 온도
- 기후변화가 해양에 미치는 영향
- 사용자:이강철 (WMKR)/심사/기후변화 문서보강 프로젝트/Happyme1/기후변화가 해양에 미치는 영향/4월 19일
- 사용자:이강철 (WMKR)/심사/기후변화 문서보강 프로젝트/Happyme1/기후변화가 해양에 미치는 영향/4월 22일
- 사용자:이강철 (WMKR)/심사/기후변화 문서보강 프로젝트/Happyme1/기후변화가 해양에 미치는 영향/4월 24일
- 사용자:이강철 (WMKR)/심사/기후변화 문서보강 프로젝트/Happyme1/기후변화가 해양에 미치는 영향/4월 25일
- 사용자:이강철 (WMKR)/심사/기후변화 문서보강 프로젝트/Happyme1/기후변화가 해양에 미치는 영향/4월 28일
- Usage on ku.wikipedia.org
- Usage on mk.wikipedia.org
- Usage on www.wikidata.org
- Usage on zh.wikipedia.org