File:Kapuni-m3.svg
Jump to navigation
Jump to search

Size of this PNG preview of this SVG file: 578 × 434 pixels. Other resolutions: 320 × 240 pixels | 639 × 480 pixels | 1,023 × 768 pixels | 1,280 × 961 pixels | 2,560 × 1,922 pixels.
Original file (SVG file, nominally 578 × 434 pixels, file size: 6 KB)
Captions
Captions
Add a one-line explanation of what this file represents
Summary[edit]
| Description |
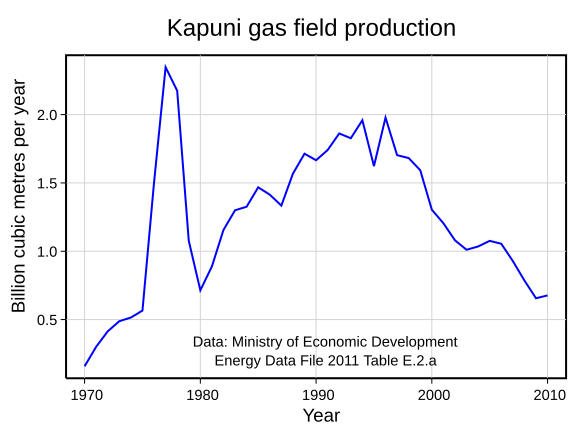
English: Kapuni gas field production |
| Date | |
| Source | Own work |
| Author | Mrfebruary |
Licensing[edit]
I, the copyright holder of this work, hereby publish it under the following license:
This file is licensed under the Creative Commons Attribution-Share Alike 3.0 Unported license.
- You are free:
- to share – to copy, distribute and transmit the work
- to remix – to adapt the work
- Under the following conditions:
- attribution – You must give appropriate credit, provide a link to the license, and indicate if changes were made. You may do so in any reasonable manner, but not in any way that suggests the licensor endorses you or your use.
- share alike – If you remix, transform, or build upon the material, you must distribute your contributions under the same or compatible license as the original.
Data[edit]
Ministry of Economic Development Energy Data File 2011 Spread Sheet E Gas Work sheet Table E.2a: Total Natural Gas Production by Field (Mm3) has been copied from the EDF 2011 spreadsheets to: https://docs.google.com/spreadsheet/ccc?key=0AsLhMBA3NXL4dElpNnJHR0dqRG90LU9FVlg4UkZITmc where it is saved as "edfe2a.csv"
R code[edit]
Download "edfe2a.csv" from https://docs.google.com/spreadsheet/ccc?key=0AsLhMBA3NXL4dElpNnJHR0dqRG90LU9FVlg4UkZITmc to your working R directory.
I also edited the svg file with a text editor to increase the font sizes
File history
Click on a date/time to view the file as it appeared at that time.
| Date/Time | Thumbnail | Dimensions | User | Comment | |
|---|---|---|---|---|---|
| current | 10:37, 31 May 2012 | | 578 × 434 (6 KB) | Mrfebruary (talk | contribs) |
You cannot overwrite this file.
File usage on Commons
There are no pages that use this file.