File:KanColle user penetration.png
Original file (855 × 438 pixels, file size: 35 KB, MIME type: image/png)
Captions
Captions
Summary[edit]
| Description |
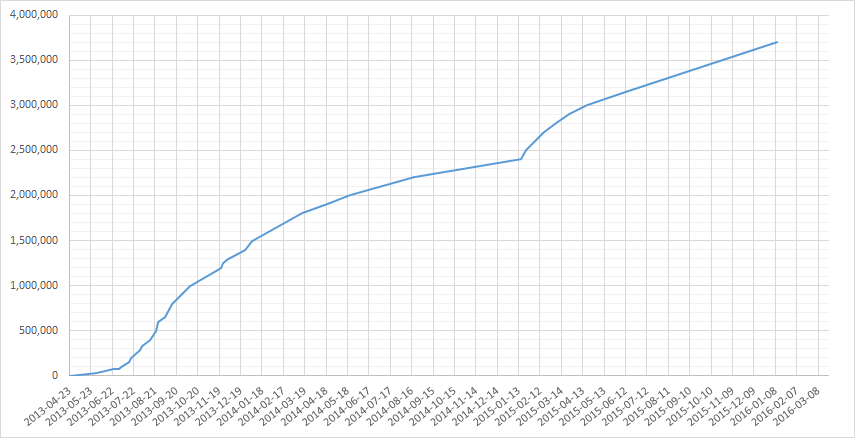
English: Data plot of the user penetration of the online game Kantai Collection. Values are from 2013-04-23 to 2016-`-11. The blue data series represents an approximation of the number of players registered to the game, based on data values announced by the developers on the official Twitter page, and other official announcements. Raw numerical data is compiled based on official information available.
Data used to plot the graph:
23-04-2013       -
30-05-2013       30,000
23-06-2013       78,460
2-07-2013        78,460
4-07-2013        100,000
15-07-2013       150,000
19-07-2013       200,000
31-07-2013       280,000
3-08-2013        326,000
14-08-2013       400,000
22-08-2013       500,000
26-08-2013       600,000
4-09-2013        650,000
14-09-2013       800,000
9-10-2013        1,000,000
22-11-2013       1,200,000
25-11-2013       1,250,000
1-12-2013        1,300,000
26-12-2013       1,400,000
4-01-2014        1,500,000
15-03-2014       1,800,000
19-04-2014       1,900,000
22-05-2014       2,000,000
20-08-2014       2,200,000
16-01-2015       2,400,000
23-01-2015       2,500,000
17-02-2015       2,700,000
7-03-2015        2,800,000
25-03-2015       2,900,000
19-04-2015       3,000,000
11-06-2015       3,150,000
11-01-2016       3,700,000
data values taken from references cited by moegirl wiki KanColle Naval District article as well as Chinese Wikipedia KanColle article, http://blog.livedoor.jp/kankore200/archives/28738745.html, http://blog.livedoor.jp/kan_mato/archives/30011066.html, http://blog.livedoor.jp/kankore200/archives/29145402.html, https://twitter.com/kyou_C2/status/356190290236817409, http://kancolle.doorblog.jp/archives/30645280.html http://blog.livedoor.jp/kankore200/archives/30314672.html, http://kanmusu.blomaga.jp/articles/54282.html, http://blog.livedoor.jp/kankore200/archives/30152102.html, http://hukugouzainahibi.blog.fc2.com/blog-entry-829.html Note that some blog article linked here are actually copies of sources that are potentially behind registration wall and some tweets quoted are from official twitter account. Possible Addition: Add a 20k "target" line to the game, according to http://kancolle.doorblog.jp/archives/30645280.html Derived into: |
| Date | |
| Source | Own work |
| Author | Benlisquare, C933103 |
| Permission (Reusing this file) |
I created this graphical plot from an aggregation of data, based on numerical information that is freely available. |

|
This graph image could be re-created using vector graphics as an SVG file. This has several advantages; see Commons:Media for cleanup for more information. If an SVG form of this image is available, please upload it and afterwards replace this template with
{{vector version available|new image name}}.
It is recommended to name the SVG file “KanColle user penetration.svg”—then the template Vector version available (or Vva) does not need the new image name parameter. |
Licensing[edit]
- You are free:
- to share – to copy, distribute and transmit the work
- to remix – to adapt the work
- Under the following conditions:
- attribution – You must give appropriate credit, provide a link to the license, and indicate if changes were made. You may do so in any reasonable manner, but not in any way that suggests the licensor endorses you or your use.
- share alike – If you remix, transform, or build upon the material, you must distribute your contributions under the same or compatible license as the original.

|
Permission is granted to copy, distribute and/or modify this document under the terms of the GNU Free Documentation License, Version 1.2 or any later version published by the Free Software Foundation; with no Invariant Sections, no Front-Cover Texts, and no Back-Cover Texts. A copy of the license is included in the section entitled GNU Free Documentation License. |
File history
Click on a date/time to view the file as it appeared at that time.
| Date/Time | Thumbnail | Dimensions | User | Comment | |
|---|---|---|---|---|---|
| current | 12:02, 23 March 2016 | | 855 × 438 (35 KB) | C933103 (talk | contribs) | forget to disable border in previous upload... |
| 12:00, 23 March 2016 |  | 855 × 438 (35 KB) | C933103 (talk | contribs) | update with correction | |
| 08:28, 18 June 2015 |  | 856 × 460 (21 KB) | C933103 (talk | contribs) | Self-made via MS Excel, release to Public domain. Data used to plot the graph: 23-04-2013 - 20-06-2013 70,000 3-07-2013 70,000 15-07-2013 200,000 8-08-2013 300,000 14-08-2013 400,000 22-08-2013 500,000 26-08-2013 600,000 4-09-2013 6... | |
| 00:20, 16 January 2014 |  | 899 × 491 (22 KB) | Benlisquare (talk | contribs) | minor tweak | |
| 18:17, 15 January 2014 |  | 905 × 501 (23 KB) | Benlisquare (talk | contribs) | tidy up edges | |
| 18:16, 15 January 2014 |  | 924 × 501 (17 KB) | Benlisquare (talk | contribs) | {{Information |Description ={{en|1=Data plot of the user penetration of the online game ''Kantai Collection''. Values are from 2013-04-23 to 2013-10-31. The red data series represents an approximation of the number of playe... |
You cannot overwrite this file.
File usage on Commons
The following page uses this file:
File usage on other wikis
The following other wikis use this file:
- Usage on vi.wikipedia.org
- Usage on zh.wikipedia.org