File:Ice Storm Chart ne.svg
Jump to navigation
Jump to search

Size of this PNG preview of this SVG file: 536 × 599 pixels. Other resolutions: 215 × 240 pixels | 429 × 480 pixels | 687 × 768 pixels | 916 × 1,024 pixels | 1,831 × 2,048 pixels | 643 × 719 pixels.
Original file (SVG file, nominally 643 × 719 pixels, file size: 13 KB)
Captions
Captions
Ice Strom Chart
Summary[edit]
| Description |
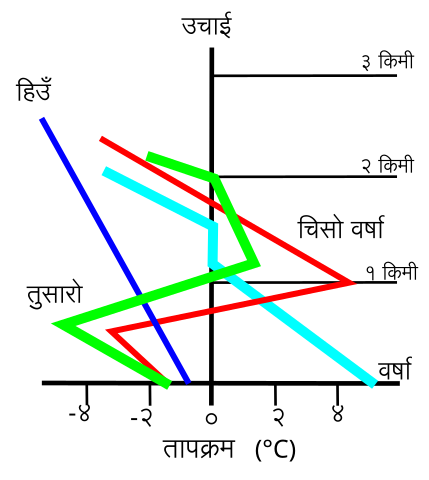
English: A graph showing the formation of freezing rain with relation to the formation of snow, sleet, and rain. Original png-image is derived from two figures in (Gay, David A.; Robert E. Davis (1993-12-30). "Freezing rain and sleet climatology of the southeastern USA". Climate Research 3 (1): 209-220. http://www.int-res.com/articles/cr/3/c003p209.pdf). |
| Date | |
| Source | File:Ice Storm Chart.svg by RicHard-59 based on image by J.R. Carmichael |
| Author | Translated in Nepali by Janak Bhatta |
| Other versions |
[]
|


Licensing[edit]
This file is licensed under the Creative Commons Attribution-Share Alike 4.0 International license.
- You are free:
- to share – to copy, distribute and transmit the work
- to remix – to adapt the work
- Under the following conditions:
- attribution – You must give appropriate credit, provide a link to the license, and indicate if changes were made. You may do so in any reasonable manner, but not in any way that suggests the licensor endorses you or your use.
- share alike – If you remix, transform, or build upon the material, you must distribute your contributions under the same or compatible license as the original.
File history
Click on a date/time to view the file as it appeared at that time.
| Date/Time | Thumbnail | Dimensions | User | Comment | |
|---|---|---|---|---|---|
| current | 09:56, 16 March 2019 | | 643 × 719 (13 KB) | Janak Bhatta (talk | contribs) | User created page with UploadWizard |
You cannot overwrite this file.
File usage on Commons
The following 7 pages use this file: