File:Graph of sin(exp(x)) function.svg
Jump to navigation
Jump to search

Size of this PNG preview of this SVG file: 512 × 384 pixels. Other resolutions: 320 × 240 pixels | 640 × 480 pixels | 1,024 × 768 pixels | 1,280 × 960 pixels | 2,560 × 1,920 pixels.
Original file (SVG file, nominally 512 × 384 pixels, file size: 16 KB)
Captions
Captions
Add a one-line explanation of what this file represents
Summary[edit]
| Description |
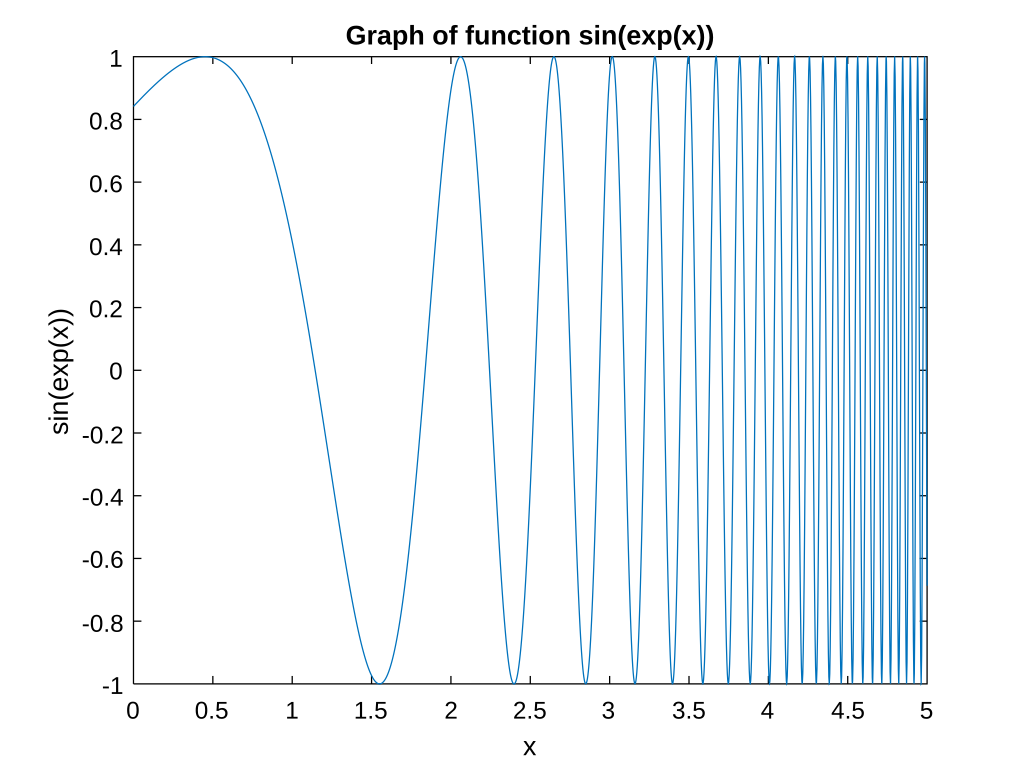
English: Graph of sin(exp(x)) function |
| Date | |
| Source | Own work based on: Graph of sin(exp(x)) function.png |
| Author | Adam majewski |
| Other versions |
|
| SVG development | This diagram was created with MATLAB. This file uses embedded text that can be easily translated using a text editor. |
| Source code | MATLAB codex=0.0:0.00000001:5.0;
plot(x,sin(exp(x)));
xlabel("x");
ylabel("sin(exp(x))");
title("Graph of function sin(exp(x))");
print('-dsvg','Graph of sin(exp(x)) function7.svg')
|

)_function.svg&action=edit§ion=1)
)_function.png)
Licensing[edit]
)_function.svg&action=edit§ion=2)
I, the copyright holder of this work, hereby publish it under the following license:
This file is licensed under the Creative Commons Attribution-Share Alike 4.0 International license.
- You are free:
- to share – to copy, distribute and transmit the work
- to remix – to adapt the work
- Under the following conditions:
- attribution – You must give appropriate credit, provide a link to the license, and indicate if changes were made. You may do so in any reasonable manner, but not in any way that suggests the licensor endorses you or your use.
- share alike – If you remix, transform, or build upon the material, you must distribute your contributions under the same or compatible license as the original.
File history
Click on a date/time to view the file as it appeared at that time.
| Date/Time | Thumbnail | Dimensions | User | Comment | |
|---|---|---|---|---|---|
| current | 19:58, 16 March 2020 | | 512 × 384 (16 KB) | JoKalliauer (talk | contribs) | white background // Editing SVG source code using c:User:Rillke/SVGedit.js |
| 19:55, 16 March 2020 |  | 512 × 384 (15 KB) | JoKalliauer (talk | contribs) | optimized scour, svgcleaner, svgo, texteditor | |
| 19:52, 16 March 2020 |  | 560 × 420 (88 KB) | JoKalliauer (talk | contribs) | ingreased precission; unedited from Matlab2019b x=0.0:0.00000001:5.0; plot(x,sin(exp(x))); xlabel("x"); ylabel("sin(exp(x))"); title("Graph of function sin(exp(x))"); print('-dsvg','Graph of sin(exp(x)) function7.svg') | |
| 15:58, 15 March 2020 |  | 560 × 420 (41 KB) | JoKalliauer (talk | contribs) | x=0.0:0.000001:5.0; plot(x,sin(exp(x))); xlabel("x"); ylabel("sin(exp(x))"); title("Graph of function sin(exp(x))"); |
You cannot overwrite this file.
File usage on Commons
The following page uses this file:
)_function.svg&oldid=729410845)