File:Global temperature change - decadal averages, 1880s-2000s (NOAA).png
Jump to navigation
Jump to search
Size of this preview: 789 × 600 pixels. Other resolutions: 316 × 240 pixels | 632 × 480 pixels | 1,011 × 768 pixels | 1,280 × 973 pixels | 2,560 × 1,945 pixels | 3,257 × 2,475 pixels.
Original file (3,257 × 2,475 pixels, file size: 74 KB, MIME type: image/png)
Captions
Captions
Add a one-line explanation of what this file represents
Summary[edit]
| Description |
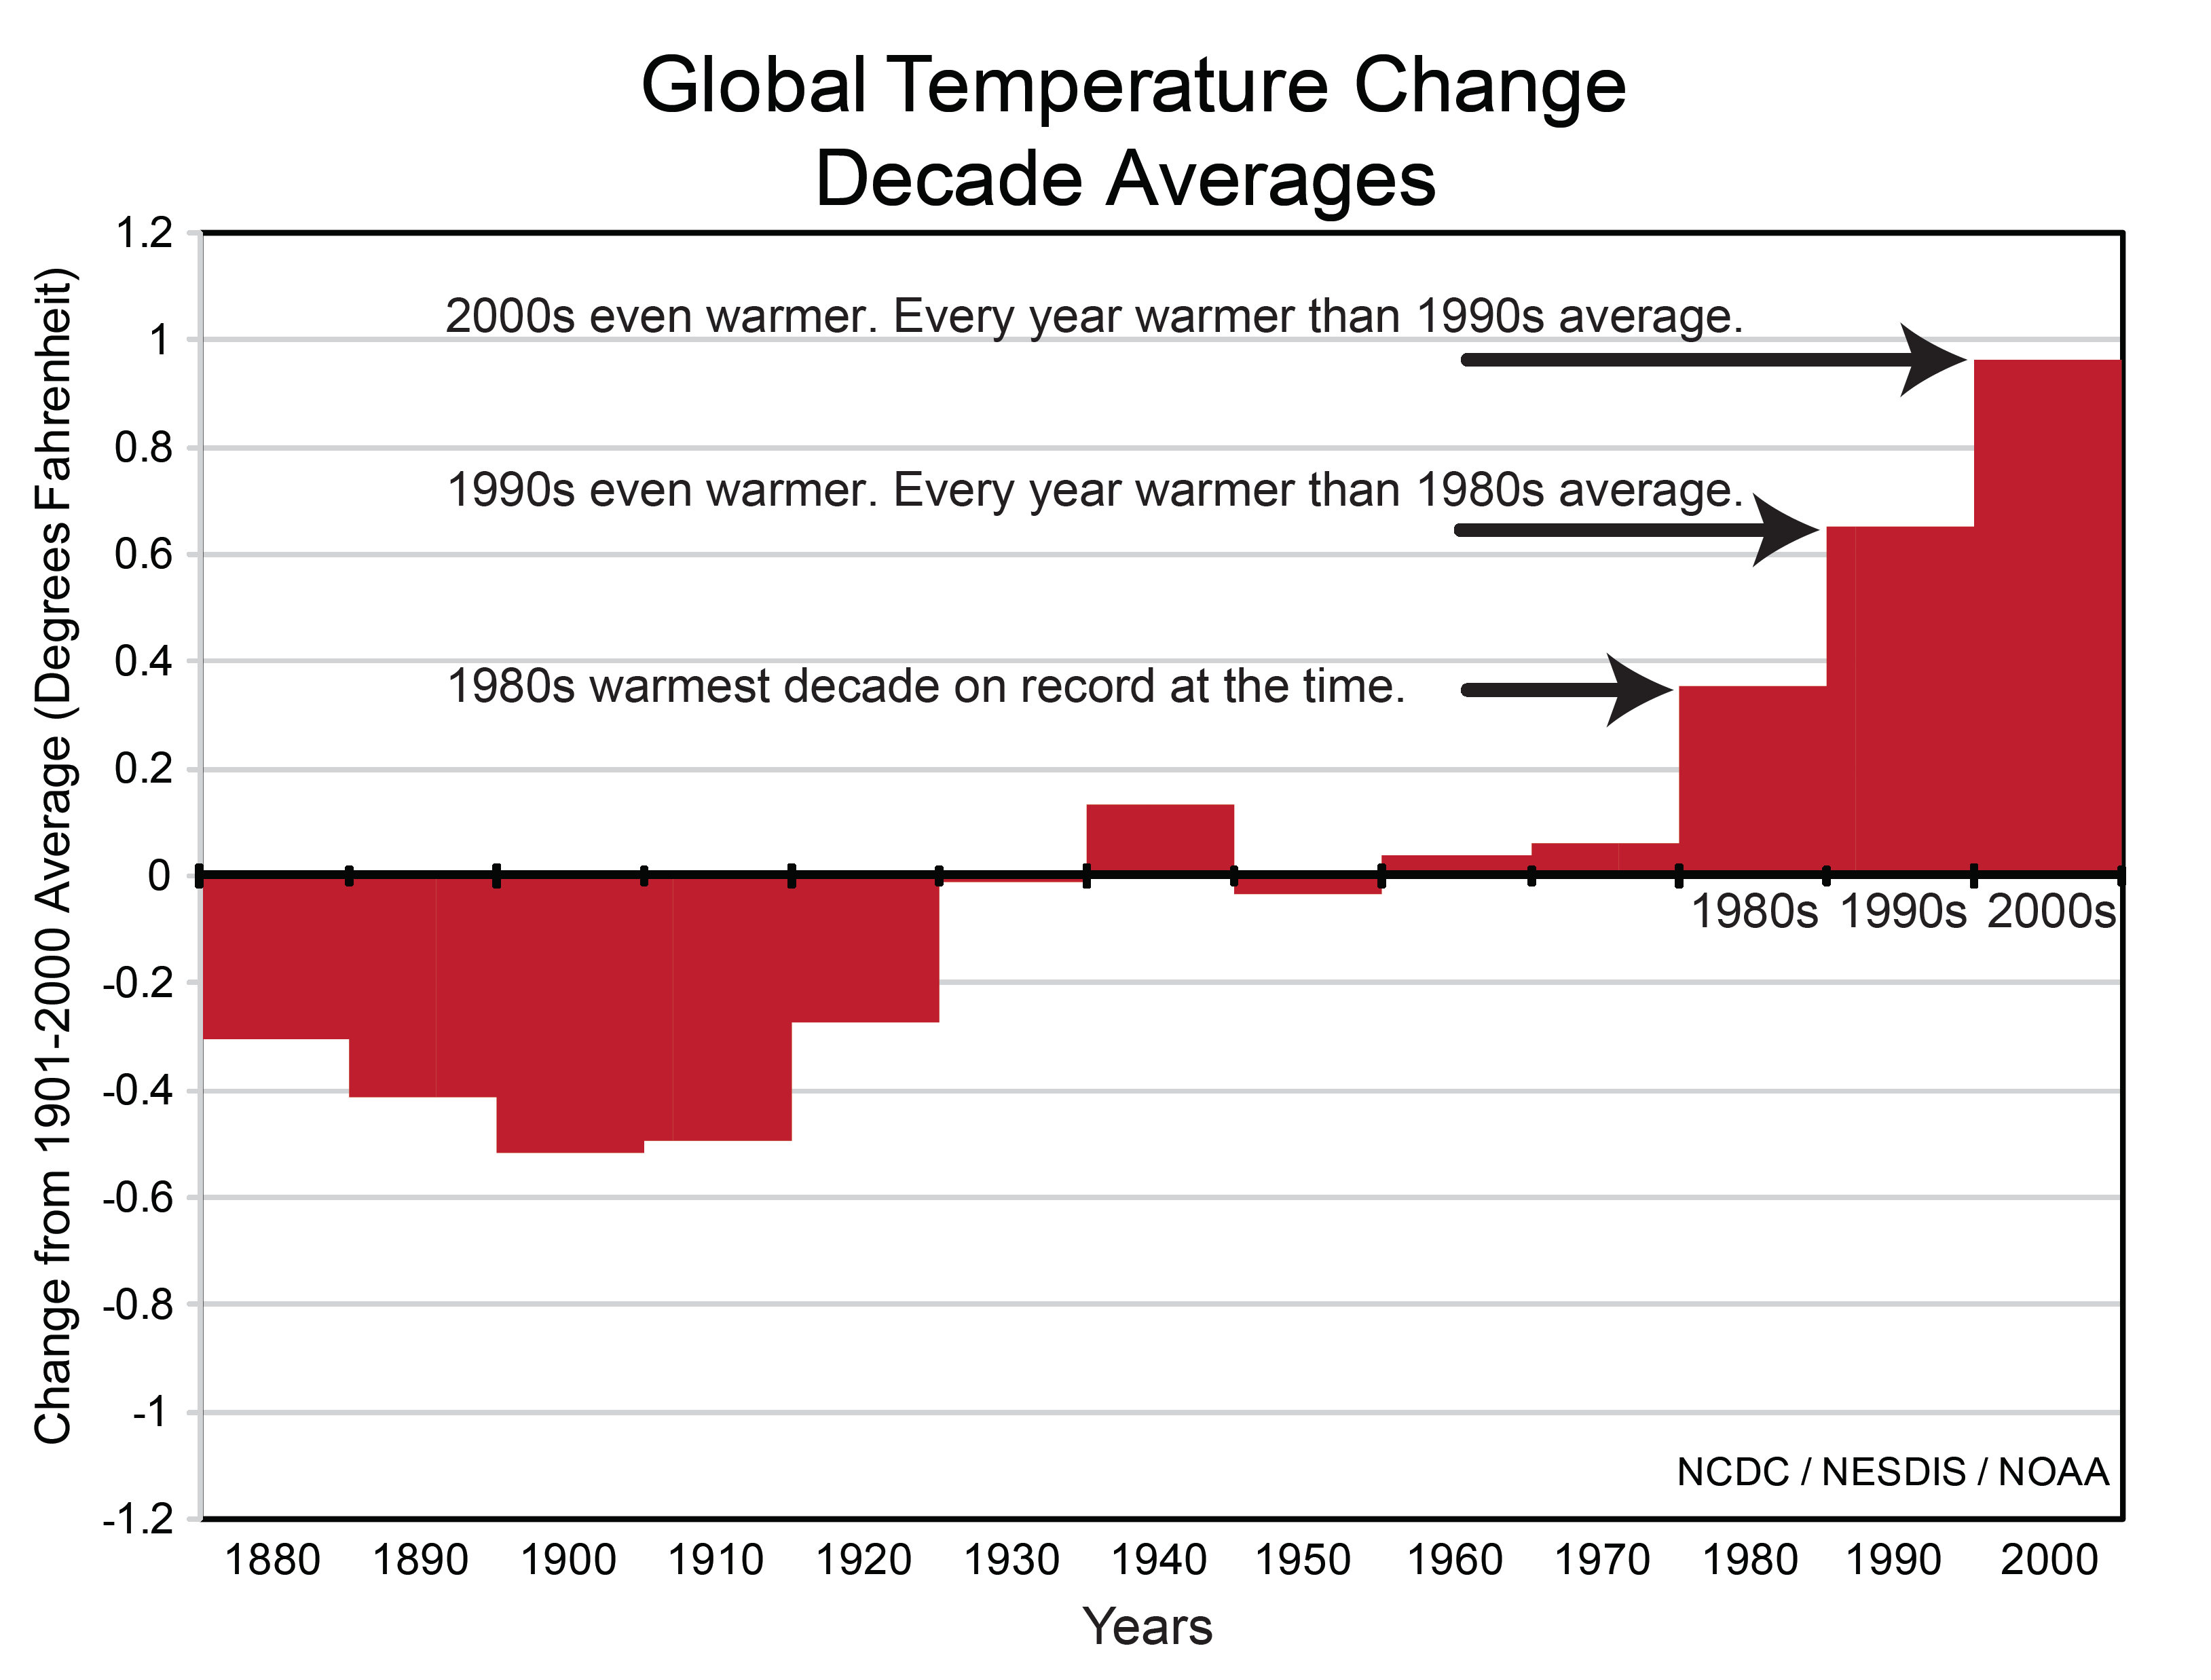
English: This bar graph shows changes in global mean temperature between the 1880s and 2000s. Temperature changes are averaged over each decade. From the public-domain source: "While year-to-year changes in temperature often reflect natural climatic variations such as El Niño/La Niña events, changes in average temperature from decade to decade reveal a long-term warming. Each of the last three decades has been much warmer than the decade before it, with each one setting a new and significant record for the highest global temperature. At the time, the 1980s was the hottest decade on record. But in the 1990s, every year was warmer than the average of the previous decade, and the 2000s were warmer still."
Data Temperature changes are measured against the 1901-2000 average, and are measured in degrees Fahrenheit. Values given below have been read from the graph and are therefore approximate:
|
| Date | |
| Source | NOAA (July 2010) State of the Climate in 2009, as appearing in the July 2010 issue (Vol. 91) of the Bulletin of the American Meteorological Society (BAMS). Supplemental and Summary Materials: Report at a Glance: Highlights[1], US National Oceanic and Atmospheric Administration (NOAA): National Climatic Data Center, p.5. |
| Author | NOAA |
Related file[edit]
-
 20211115 Progression of global warming - decadal analysis - bar chart.svg
Updated version, showing average and range of decadal temperatures

.png&action=edit§ion=1)
.png&action=edit§ion=2)
Licensing[edit]
.png&action=edit§ion=3)
This image is in the public domain because it contains materials that originally came from the U.S. National Oceanic and Atmospheric Administration, taken or made as part of an employee's official duties.
|
File history
Click on a date/time to view the file as it appeared at that time.
| Date/Time | Thumbnail | Dimensions | User | Comment | |
|---|---|---|---|---|---|
| current | 08:50, 11 May 2013 | | 3,257 × 2,475 (74 KB) | Enescot (talk | contribs) | {{Information |Description ={{en|1=This bar graph shows changes in global mean temperature between the 1880s and 2000s. Temperature changes are averaged over each decade. From the public-domain source: "While ... |
You cannot overwrite this file.
File usage on Commons
The following page uses this file:
File usage on other wikis
The following other wikis use this file:
- Usage on he.wiktionary.org
.png&oldid=607231306)