File:Genetic Differentiation of 2,554 British and Irish individuals using ADMIXTURE Analysis.png
Jump to navigation
Jump to search

Size of this preview: 800 × 532 pixels. Other resolutions: 320 × 213 pixels | 640 × 425 pixels | 1,024 × 680 pixels | 1,219 × 810 pixels.
Original file (1,219 × 810 pixels, file size: 695 KB, MIME type: image/png)
Captions
Captions
Add a one-line explanation of what this file represents
Summary[edit]
| Description |
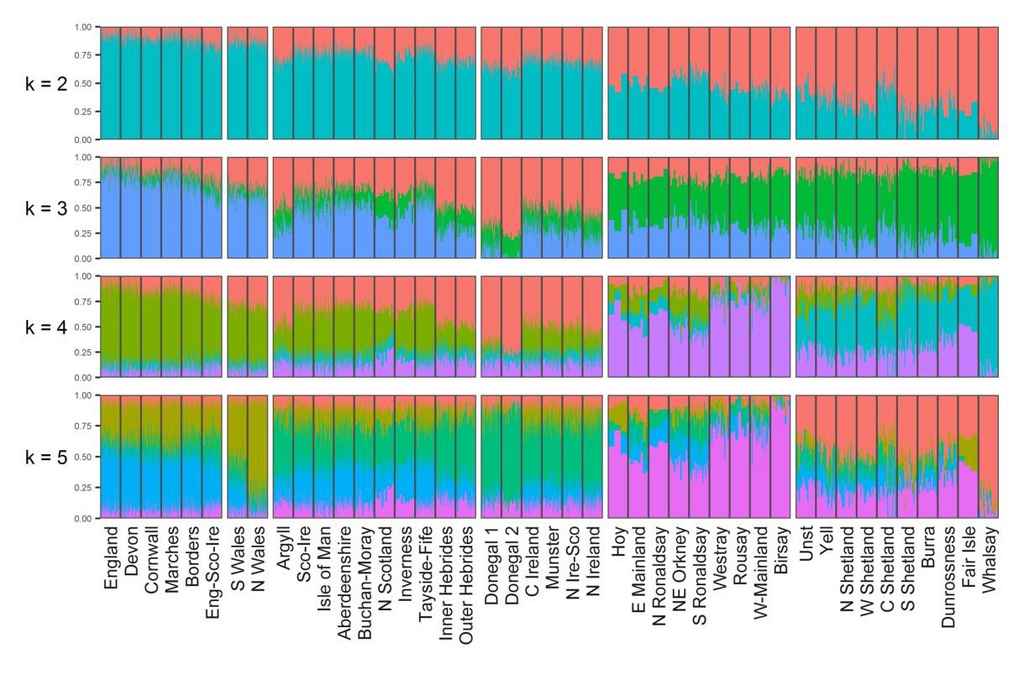
English: The maximum likelihood ancestry profiles of the Irish and British individuals using ADMIXTURE analysis, showing estimates for k populations from 2-5. All panels were plotted in R, using the ggplot2 package. |
| Date | First published: September 3, 2019 |
| Source | Gilbert E, O'Reilly S, Merrigan M, et al. The genetic landscape of Scotland and the Isles. Proc Natl Acad Sci U S A. 2019;116(38):19064–19070. https://doi.org/10.1073/pnas.1904761116 |
| Author | Edmund Gilbert, Seamus O’Reilly, Michael Merrigan, Darren McGettigan, Veronique Vitart, Peter K. Joshi, David W. Clark, Harry Campbell, Caroline Hayward, Susan M. Ring, Jean Golding, Stephanie Goodfellow, Pau Navarro, Shona M. Kerr, Carmen Amador, Archie Campbell, Chris S. Haley, David J. Porteous, Gianpiero L. Cavalleri, and James F. Wilson |
| Other versions |
|


Licensing[edit]
This file is licensed under the Creative Commons Attribution 4.0 International license.
- You are free:
- to share – to copy, distribute and transmit the work
- to remix – to adapt the work
- Under the following conditions:
- attribution – You must give appropriate credit, provide a link to the license, and indicate if changes were made. You may do so in any reasonable manner, but not in any way that suggests the licensor endorses you or your use.
File history
Click on a date/time to view the file as it appeared at that time.
| Date/Time | Thumbnail | Dimensions | User | Comment | |
|---|---|---|---|---|---|
| current | 13:23, 22 December 2019 | | 1,219 × 810 (695 KB) | Was a bee (talk | contribs) | {{Information |Description={{en|1= The maximum likelihood ancestry profiles of the Irish and British individuals using ADMIXTURE analysis, showing estimates for k populations from 2-5. All panels were plotted in R, using the ggplot2 package..}} |Source=Gilbert E, O'Reilly S, Merrigan M, et al. The genetic landscape of Scotland and the Isles. Proc Natl Acad Sci U S A. 2019;116(38):19064–19070. https://doi.org/10.1073/pnas.1904761116 |Date=First published: September 3, 2019 |Author=Edmund Gilbe... |
You cannot overwrite this file.
File usage on Commons
The following 3 pages use this file: