File:Diagrama de fases binari-punt ebullició.png
From Wikimedia Commons, the free media repository
Jump to navigation
Jump to search
Diagrama_de_fases_binari-punt_ebullició.png (493 × 381 pixels, file size: 13 KB, MIME type: image/png)
File information
Structured data
Captions
Captions
Add a one-line explanation of what this file represents
| DescriptionDiagrama de fases binari-punt ebullició.png |
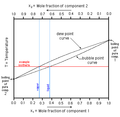
English: Binary Boiling Point Diagram (graph) of a hypothetical mixture of two components without an azeotrope. An example isotherm line is shown to compare vapor and liquid compositions at that temperature. |
| Date | (UTC) |
| Source | |
| Author |
|
| Other versions |
[edit]
.png:
|
| This is a retouched picture, which means that it has been digitally altered from its original version. Modifications: Translation to Catalan and Vapor/Liquid areas specification. The original can be viewed here: Binary Boiling Point Diagram new.svg:
|
I, the copyright holder of this work, hereby publish it under the following license:
This file is licensed under the Creative Commons Attribution-Share Alike 2.5 Generic license.
- You are free:
- to share – to copy, distribute and transmit the work
- to remix – to adapt the work
- Under the following conditions:
- attribution – You must give appropriate credit, provide a link to the license, and indicate if changes were made. You may do so in any reasonable manner, but not in any way that suggests the licensor endorses you or your use.
- share alike – If you remix, transform, or build upon the material, you must distribute your contributions under the same or compatible license as the original.
Original upload log[edit]
This image is a derivative work of the following images:
- File:Binary_Boiling_Point_Diagram_new.svg licensed with Cc-by-sa-2.5
- 2009-11-10T10:00:01Z Michbich 391x378 (19968 Bytes) once more
- 2009-11-10T09:58:30Z Michbich 391x378 (19968 Bytes) tried fixing the fonts
- 2009-11-10T09:56:36Z Michbich 391x378 (19943 Bytes) {{Information |Description={{en|Binary Boiling Point Diagram (graph) of a hypothetical mixture of two components '''without''' an azeotrope. An example isotherm line is shown to compare vapor and liquid compositions at that
Uploaded with derivativeFX
File history
Click on a date/time to view the file as it appeared at that time.
| Date/Time | Thumbnail | Dimensions | User | Comment | |
|---|---|---|---|---|---|
| current | 21:42, 1 January 2011 |  | 493 × 381 (13 KB) | Gcarotsans (talk | contribs) | {{Information |Description={{en|Binary Boiling Point Diagram (graph) of a hypothetical mixture of two components '''without''' an azeotrope. An example isotherm line is shown to compare vapor and liquid compositions at that temperature.}} |Source=*[[:Fil |
You cannot overwrite this file.
File usage on Commons
The following 8 pages use this file:
- File:Binary Boiling Point Diagram.PNG
- File:Binary Boiling Point Diagram new-ru.svg
- File:Binary Boiling Point Diagram new.svg
- File:Binäres Siedepunktsdiagramm AB.svg
- File:Binäres Siedepunktsdiagramm neu.svg
- File:Diagrama de fases binari-punt ebullició.png
- File:Diagramme binaire liquide-vapeur.svg
- Template:Other versions/Binary Boiling Point Diagram
File usage on other wikis
The following other wikis use this file:
- Usage on ca.wikipedia.org


