File:Convex Function.png
Jump to navigation
Jump to search

Size of this preview: 800 × 533 pixels. Other resolutions: 320 × 213 pixels | 640 × 427 pixels | 1,024 × 683 pixels | 1,200 × 800 pixels.
Original file (1,200 × 800 pixels, file size: 10 KB, MIME type: image/png)
Captions
Captions
Add a one-line explanation of what this file represents

|
File:Convex Function.svg is a vector version of this file. It should be used in place of this PNG file.
File:Convex Function.png → File:Convex Function.svg
For more information, see Help:SVG. |
 |
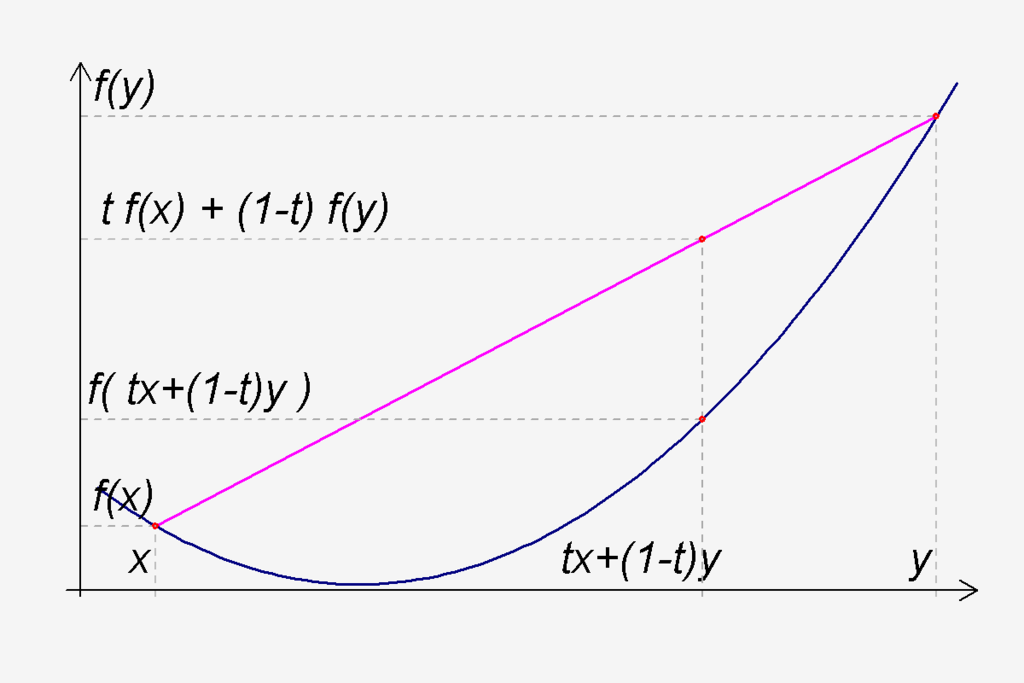
| Description | graph of a convex function (which? see the source code) |
| Date | |
| Source | created with GNU R, see source below. I tried somehow to replicate the image mentioned in "other versions" |
| Author | Thomas Steiner |
| Permission (Reusing this file) |
Thomas Steiner put it under the CC-by-SA 2.5. |
| Other versions |
 |
This file is licensed under the Creative Commons Attribution-Share Alike 2.5 Generic license.
- You are free:
- to share – to copy, distribute and transmit the work
- to remix – to adapt the work
- Under the following conditions:
- attribution – You must give appropriate credit, provide a link to the license, and indicate if changes were made. You may do so in any reasonable manner, but not in any way that suggests the licensor endorses you or your use.
- share alike – If you remix, transform, or build upon the material, you must distribute your contributions under the same or compatible license as the original.
Read at User_talk:AtonX#SVG_of_convex_function, why I prefer the .png to the .svg
R-source code:
from=-0.9
to=2.05
a=seq(from,to,length=100)

con<-function(p) {
  p^2+0.1
}

png(filename="Convex_Function.png", width=1200, height=800, pointsize=12)

par(lwd=2,bg="whitesmoke",font=3)

plot(a,con(a),type="l",col="navy",lwd=3,xlab="",ylab="", axes=FALSE)

st=par("usr")[1]+0.06
ady=c(-0.2,-0.5)
adx=c(1.25,-0.75)
x=-0.7
y=1.98
t=0.3
z=x*t+y*(1-t)
m=((con(y)-con(x))/(y-x))*z + con(x)-((con(y)-con(x))/(y-x))*x
sz=3.2

##gerade
lines(c(x,y),c(con(x),con(y)),col="magenta",lwd=3)

## x
lines(c(x,x),c(0,con(x)),type="l",lty=2,col="grey")
text(x,0,labels="x",adj=adx,cex=sz)
lines(c(st,x),c(con(x),con(x)),col="darkgrey",lty=2)
text(st,con(x),labels="f(x)",adj=ady,cex=sz)
lines(x,con(x),type="p",lwd=3,col="red")

## y
lines(c(y,y),c(0,con(y)),type="l",lty=2,col="grey")
text(y,0,labels="y",adj=adx,cex=sz)
lines(c(st,y),c(con(y),con(y)),col="darkgrey",lty=2)
text(st,con(y),labels="f(y)",adj=ady,cex=sz)
lines(y,con(y),type="p",lwd=3,col="red")

## zwischenstelle z
lines(c(z,z),c(0,con(z)),type="l",lty=2,col="grey")
text(z+0.2,0,labels="tx+(1-t)y",adj=adx,cex=sz)
lines(c(st,z),c(con(z),con(z)),col="darkgrey",lty=2)
lines(c(z,z),c(0,m),type="l",lty=2,col="darkgrey")
lines(c(st,z),c(m,m),col="grey",lty=2)
text(st-0.13,con(z),labels="f( tx+(1-t)y )",adj=ady,cex=sz)
text(st-0.13,m,labels="t f(x) + (1-t) f(y)",adj=ady,cex=sz)
lines(z,con(z),type="p",lwd=3,col="red")
lines(z,m,type="p",lwd=3,col="red")

arrows(st-0.05,0.05,par("usr")[2]-0.05,0.05)
arrows(st,0,st,par("usr")[4])

dev.off()
File history
Click on a date/time to view the file as it appeared at that time.
| Date/Time | Thumbnail | Dimensions | User | Comment | |
|---|---|---|---|---|---|
| current | 11:19, 2 December 2006 | | 1,200 × 800 (10 KB) | Thire (talk | contribs) | now the new image |
| 15:35, 27 November 2006 |  | 1,200 × 800 (10 KB) | Thire (talk | contribs) | now the file... | |
| 14:52, 25 November 2006 |  | 1,200 × 800 (8 KB) | Thire (talk | contribs) | better version | |
| 15:56, 15 November 2006 |  | 1,024 × 768 (8 KB) | Thire (talk | contribs) | {{Information| |Description = graph of a convex function (which? see the source code) |Source = created with GNU R, see source below. I tried somehow to replicate the image mentioned in "other versions" |Date = 14 nov. 2006 |Author = [[:de:Benutzer:Thire| |
You cannot overwrite this file.
File usage on Commons
The following 13 pages use this file:
- Wikimedia logo mosaic
- Wikimedia logo mosaic/A-Z gallery/B-C
- User:Ash Crow/test
- User:Bugboy52.4
- User:Cyc~commonswiki
- User:Lar/Mosaic2
- User:OhanaUnited/Wikispecies logo mosaic
- User:Prolineserver/mosaic
- User:Przykuta/Gender mosaic
- User:Twice25/Mosaic
- User talk:Symode09/Large
- Commons:STOP!!!! DO NOT DELETE THIS IMAGE TILL YOU REPLACE IT IN THE WIKIMEDIA LOGO MOSAIC
- File:Convex Function.svg
File usage on other wikis
The following other wikis use this file:
- Usage on de.wikibooks.org
- Usage on id.wikipedia.org