File:CBO Forecast Changes for 2009-2012.png

Original file (960 × 720 pixels, file size: 15 KB, MIME type: image/png)
Captions
Captions
Summary[edit]
| Description |
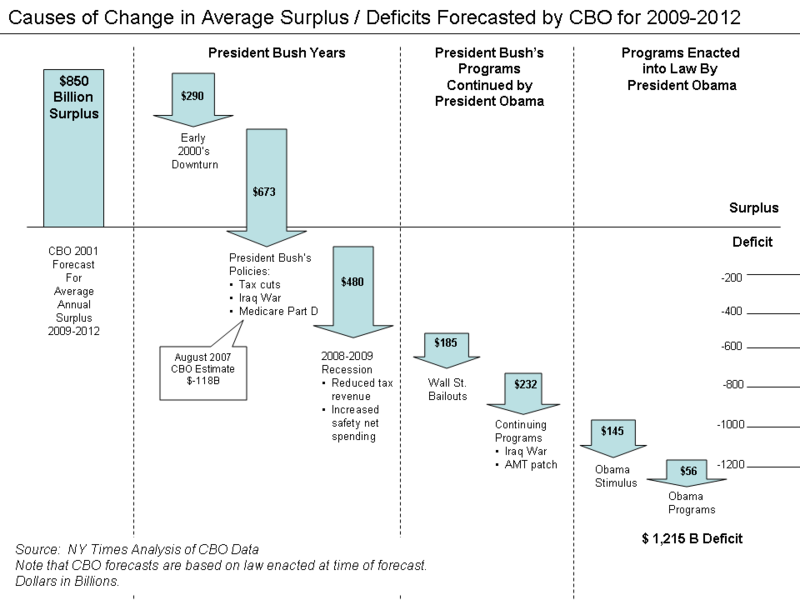
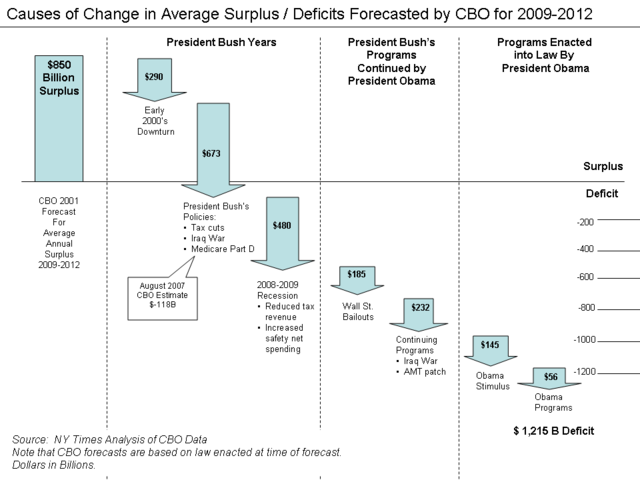
English: CBO Forecast Changes for 2009-2012 period; chart based on NYT article cited below Interpreting the graphThe U.S. budget situation has deteriorated significantly since 2001, when the Congressional Budget Office (CBO) forecast average annual surpluses of approximately $850 billion from 2009-2012. The average deficit forecast in each of those years is now approximately $1,215 billion. The NY Times analyzed this roughly $2 trillion "swing," separating the causes into four major categories along with their share:
CBO data is based only on current law, so policy proposals that have yet to be made law are not included in their analysis. The article concluded that President Obama's decisions accounted for only a "sliver" of the deterioration, but that he "...does not have a realistic plan for reducing the deficit..."[1] Recessions have long-lasting impacts on forecasts, as they reduce the GDP estimates for future years and increase the amount of safety net spending, like unemployment and food stamps. The AMT refers to the "Alternative Minimum Tax" which would raise taxes for many middle-income families if Congress did not regularly pass a "patch" that prevented this tax increase from occurring. Many of these factors are explained in detail in the United States federal budget article. Notable economists Alan Auerbach, Alan Blinder and David Leonhardt discussed this topic on the Charlie Rose show.[2] |
| Date | |
| Source | NY Times: America's Sea of Red Ink was Years in the Making |
| Author | Farcaster (talk) 23:51, 13 June 2009 (UTC) |

|
This graph image could be re-created using vector graphics as an SVG file. This has several advantages; see Commons:Media for cleanup for more information. If an SVG form of this image is available, please upload it and afterwards replace this template with
{{vector version available|new image name}}.
It is recommended to name the SVG file “CBO Forecast Changes for 2009-2012.svg”—then the template Vector version available (or Vva) does not need the new image name parameter. |
Licensing[edit]
- You are free:
- to share – to copy, distribute and transmit the work
- to remix – to adapt the work
- Under the following conditions:
- attribution – You must give appropriate credit, provide a link to the license, and indicate if changes were made. You may do so in any reasonable manner, but not in any way that suggests the licensor endorses you or your use.
- share alike – If you remix, transform, or build upon the material, you must distribute your contributions under the same or compatible license as the original.

|
Permission is granted to copy, distribute and/or modify this document under the terms of the GNU Free Documentation License, Version 1.2 or any later version published by the Free Software Foundation; with no Invariant Sections, no Front-Cover Texts, and no Back-Cover Texts. A copy of the license is included in the section entitled GNU Free Documentation License. |
Original upload log[edit]
Transferred from en.wikipedia to Commons by Sreejithk2000 using CommonsHelper.
- 2009-06-13 23:51 Farcaster 960×720× (15836 bytes) {{Information |Description = |Source = NY Times: [http://www.nytimes.com/2009/06/10/business/economy/10leonhardt.html America's Sea of Red Ink was Years in the Making] |Date = June 2009 |Author = ~~~~ |other_versions =
File history
Click on a date/time to view the file as it appeared at that time.
| Date/Time | Thumbnail | Dimensions | User | Comment | |
|---|---|---|---|---|---|
| current | 04:56, 2 June 2010 | | 960 × 720 (15 KB) | File Upload Bot (Magnus Manske) (talk | contribs) | {{BotMoveToCommons|en.wikipedia|year={{subst:CURRENTYEAR}}|month={{subst:CURRENTMONTHNAME}}|day={{subst:CURRENTDAY}}}} {{Information |Description={{en|CBO Forecast Changes for 2009-2012 period; chart based on NYT article cited below<br/> ==Interpreting t |
You cannot overwrite this file.
File usage on Commons
There are no pages that use this file.