File:Blastcurves psi.svg

Original file (SVG file, nominally 600 × 400 pixels, file size: 73 KB)
Captions
Captions
Summary[edit]
| Description |
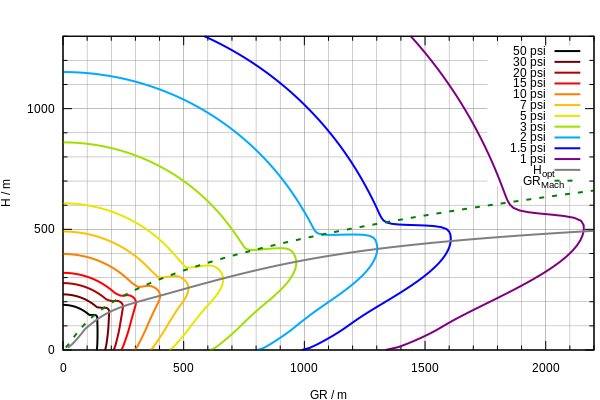
English: Overpressure ranges from 1 to 50 psi (6.9 to 345 kPa) of a 1 kiloton air burst as a function of burst height. The thin grey curve indicates the approximate optimum burst height for a given ground range.
Deutsch: Abhängigkeit des Druckpegels einer 1-Kilotonnen-Explosion von Entfernung und Detonationshöhe. Die dünne graue Kurve gibt näherungsweise die optimale Detonationshöhe an. |
| Date | Created: 21 November 2008 |
| Source | Own work |
| Author | SiriusB |
| Other versions | Image:Blastcurves_1.png |
Additional Info[edit]
Plotted with Gnuplot 4.2.2. Isobars are based on numerically solved formulae from the internal help pages of the BLAST software, the H_opt curve is an analytical fit using the inversely plotted formula

This function should fit both BLAST output and Figures 3.73a-c taken from Glasstone, Dolan, The Effects of Nuclear Weapons, 1977 (EoNW77) as a compromise. Both sources differ slightly. EoNW77 shows the maximum low-pressure ranges at somewhat lower altitudes whereas for high pressures >40 psi BLAST shows no optimum altitudes at all (see the innermost isobar). However, since numerical fitting of curves taken from a paper would be a Sisyphean task while BLAST already outputs plottable numbers, only isobars from the latter are plotted here.
A note on the new version on June 6 2022: The interpolation between the Mach zone and the regular reflection zone has been altered in order to steepen the "knees". This provides a better fit to the Figures 3.73a-c in EoNW77 where the relation of GR to H is actually not unique but features local minima at the onsets of the "knees" for intermediate overpressures. In addition, contours for 1.5, 7 and 15 psi have been added.
Why psi?[edit]
Most sources, e.g. Glasstone & Dolan (1977) or Carey Sublette's Nuclear Weapon Archive use pounds per square inch as pressure units. As a rule of the thumb, e.g. most non-reinforced buildings are destroyed for overpressures above 5 psi. However, the pressures can easily be converted into SI units, e.g. kilopascals, where 1 psi = 6.8947573 kPa or, roughly, one psi equals seven kPa.
Additional notes[edit]
A note on Gnuplot SVG terminal: Set size variable as "fixed" (the default in Gnuplot), not "dynamic", to ensure correct aspect ratio. This was the reason for uploading a 2nd version.
Licensing[edit]
| I, the copyright holder of this work, release this work into the public domain. This applies worldwide. In some countries this may not be legally possible; if so: I grant anyone the right to use this work for any purpose, without any conditions, unless such conditions are required by law. |
File history
Click on a date/time to view the file as it appeared at that time.
| Date/Time | Thumbnail | Dimensions | User | Comment | |
|---|---|---|---|---|---|
| current | 13:46, 6 June 2022 | | 600 × 400 (73 KB) | SiriusB (talk | contribs) | Modification of the Mach-to-Regular reflection zone interpolation.This steepens the |
| 10:46, 21 November 2008 |  | 600 × 400 (75 KB) | SiriusB (talk | contribs) | {{Information |Description= |Source= |Date= |Author= |Permission= |other_versions= }} | |
| 10:40, 21 November 2008 |  | 512 × 341 (75 KB) | SiriusB (talk | contribs) | {{Information |Description={{en|1=Overpressure ranges from 1 to 50 psi (6.9 to 345 kPa) of a 1 kiloton air burst as a function of burst height. The thin grey curve indicates the approximate optimum burst height for a given ground range.}} {{de|1=Abhängig |
You cannot overwrite this file.
File usage on Commons
The following page uses this file:
File usage on other wikis
The following other wikis use this file:
- Usage on de.wikipedia.org
- Usage on en.wikipedia.org
- Usage on it.wikipedia.org
- Usage on ms.wikipedia.org