File:Bird mortality blocks.svg
Jump to navigation
Jump to search

Size of this PNG preview of this SVG file: 449 × 599 pixels. Other resolutions: 180 × 240 pixels | 360 × 480 pixels | 576 × 768 pixels | 767 × 1,024 pixels | 1,535 × 2,048 pixels | 512 × 683 pixels.
Original file (SVG file, nominally 512 × 683 pixels, file size: 17 KB)
Captions
Captions
Add a one-line explanation of what this file represents
Summary[edit]
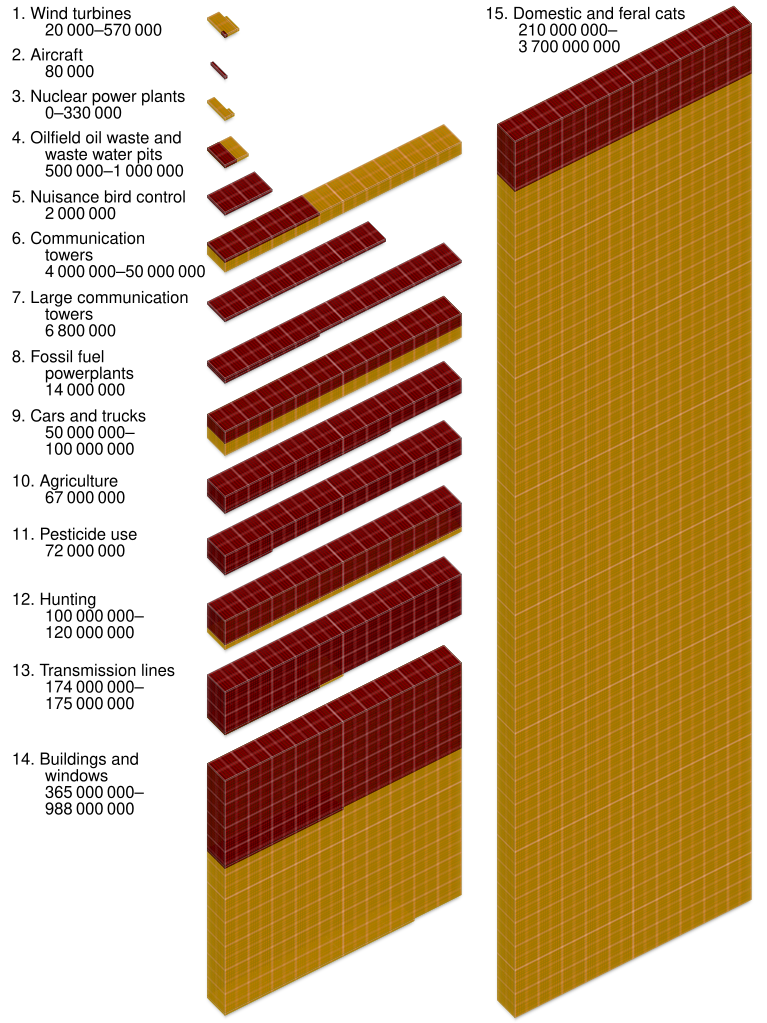
| Description | Visualization of data largely from a preliminary study conducted by B. Sovacool into causes of avian mortality in the United States, with each small cube denoting 10000 deaths a year by CMG Lee. Note that the underlying data are considered “very rough estimates” in the study, and have drawn a wide range of criticism, see for example https://atomicinsights.com/sovacool-vs-lorenzini/ and https://atomicinsights.com/nukes-kill-more-birds-than-wind/. |
| Source | Own work |
| Author | Cmglee |
| SVG development | This W3C-invalid diagram was created with an unknown SVG tool. This diagram uses embedded text that can be easily translated using a text editor. |
Licensing[edit]
I, the copyright holder of this work, hereby publish it under the following licenses:
This file is licensed under the Creative Commons Attribution-Share Alike 4.0 International license.
- You are free:
- to share – to copy, distribute and transmit the work
- to remix – to adapt the work
- Under the following conditions:
- attribution – You must give appropriate credit, provide a link to the license, and indicate if changes were made. You may do so in any reasonable manner, but not in any way that suggests the licensor endorses you or your use.
- share alike – If you remix, transform, or build upon the material, you must distribute your contributions under the same or compatible license as the original.

|
Permission is granted to copy, distribute and/or modify this document under the terms of the GNU Free Documentation License, Version 1.2 or any later version published by the Free Software Foundation; with no Invariant Sections, no Front-Cover Texts, and no Back-Cover Texts. A copy of the license is included in the section entitled GNU Free Documentation License. |
You may select the license of your choice.
File history
Click on a date/time to view the file as it appeared at that time.
| Date/Time | Thumbnail | Dimensions | User | Comment | |
|---|---|---|---|---|---|
| current | 04:00, 23 January 2022 | | 512 × 683 (17 KB) | Cmglee (talk | contribs) | Work around bug by drawing redundant rectangles so that each pattern cell is bigger than 1 px |
| 03:33, 23 January 2022 |  | 512 × 683 (16 KB) | Cmglee (talk | contribs) | Use checkerboard as per http://en.wikipedia.org/w/index.php?title=Wikipedia:SVG_help&diff=1055301881&oldid=1053188388 // Editing SVG source code using c:User:Rillke/SVGedit.js | |
| 03:13, 15 November 2021 |  | 512 × 683 (17 KB) | Cmglee (talk | contribs) | Fix ''Large communication towers'' // Editing SVG source code using c:User:Rillke/SVGedit.js | |
| 02:15, 15 November 2021 |  | 512 × 683 (17 KB) | Cmglee (talk | contribs) | Increase indent | |
| 02:09, 15 November 2021 |  | 512 × 683 (17 KB) | Cmglee (talk | contribs) | {{Information |Description=Visualization of data largely from a preliminary study conducted by B. Sovacool into causes of avian mortality in the United States, with each small cube denoting 10000 deaths a year by CMG Lee. |Source={{own}} |Date= |Author= Cmglee |Permission= |other_versions= }} Category:4-3-2 trimetric projection Category:Wind energy statistics of the United States Category:Ornithology Category:SVG diagrams in English |
You cannot overwrite this file.
File usage on Commons
The following 2 pages use this file:
File usage on other wikis
The following other wikis use this file:
- Usage on en.wikipedia.org