File:Atmosphere Composition Hand Mnemonic.png
From Wikimedia Commons, the free media repository
Jump to navigation
Jump to search

Size of this preview: 360 × 600 pixels. Other resolutions: 144 × 240 pixels | 288 × 480 pixels | 461 × 768 pixels | 1,170 × 1,950 pixels.
Original file (1,170 × 1,950 pixels, file size: 135 KB, MIME type: image/png)
File information
Structured data
Captions
Captions
Add a one-line explanation of what this file represents
Summary[edit]
| DescriptionAtmosphere Composition Hand Mnemonic.png |
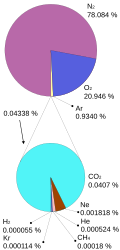
English: This diagram is a mnemonic for teaching students that, by volume, the Earth's atmosphere is composed basically of 4 parts nitrogen and 1 part oxygen. The more precise composition for dry atmosphere is 78.1% nitrogen, 20.9% oxygen, with the other 1% being mostly argon (depicted in blue) along with carbon dioxide and other trace elements (purple). Not depicted is another important component of the atmosphere: water vapor (H2O), and its proportion varies considerably though it averages roughly 1% in the troposphere. With each of the five fingers representing roughly 20% and the finger tips roughly 1%, the nitrogen can be seen as: 80% minus ~2% = 78.1%. The oxygen is 20% plus ~1% = 20.9%. The argon is ~1%. Carbon dioxide and the other trace gases are a small fraction of 1%. A table of the exact composition is listed here. And a pie chart representation is also available:  File:Atmosphere gas proportions.svg |
| Date | |
| Source | |
| Author | Tdadamemd |
Licensing[edit]
I, the copyright holder of this work, hereby publish it under the following license:
| This file is made available under the Creative Commons CC0 1.0 Universal Public Domain Dedication. | |
| The person who associated a work with this deed has dedicated the work to the public domain by waiving all of their rights to the work worldwide under copyright law, including all related and neighboring rights, to the extent allowed by law. You can copy, modify, distribute and perform the work, even for commercial purposes, all without asking permission.
http://creativecommons.org/publicdomain/zero/1.0/deed.enCC0Creative Commons Zero, Public Domain Dedicationfalsefalse |
File history
Click on a date/time to view the file as it appeared at that time.
| Date/Time | Thumbnail | Dimensions | User | Comment | |
|---|---|---|---|---|---|
| current | 09:02, 29 November 2013 |  | 1,170 × 1,950 (135 KB) | Tdadamemd (talk | contribs) | Now being exacting, to show that with each finger representing ~20%, N2 is almost 2% short of 80% and O2 is almost 1% greater than 20%. Argon is almost 1%, with CO2 etc making up the remainder of trace gases. |
| 08:09, 29 November 2013 |  | 1,170 × 1,950 (174 KB) | Tdadamemd (talk | contribs) | Modified to depict Argon along with CO2 and other trace gases. | |
| 10:39, 22 December 2012 |  | 1,234 × 2,100 (127 KB) | Tdadamemd (talk | contribs) | User created page with UploadWizard |
You cannot overwrite this file.
File usage on Commons
There are no pages that use this file.
Metadata
This file contains additional information such as Exif metadata which may have been added by the digital camera, scanner, or software program used to create or digitize it. If the file has been modified from its original state, some details such as the timestamp may not fully reflect those of the original file. The timestamp is only as accurate as the clock in the camera, and it may be completely wrong.
| Horizontal resolution | 37.8 dpc |
|---|---|
| Vertical resolution | 37.8 dpc |
| File change date and time | 08:54, 29 November 2013 |
Structured data
Items portrayed in this file
depicts
22 December 2012
image/png
fef3cad0f86f461d4cd2c2f77a708e5152dd6c25
138,611 byte
1,950 pixel
1,170 pixel
Hidden categories: