File:Acf.svg
Jump to navigation
Jump to search

Size of this PNG preview of this SVG file: 217 × 289 pixels. Other resolutions: 180 × 240 pixels | 360 × 480 pixels | 577 × 768 pixels | 769 × 1,024 pixels | 1,538 × 2,048 pixels.
Original file (SVG file, nominally 217 × 289 pixels, file size: 50 KB)
Captions
Captions
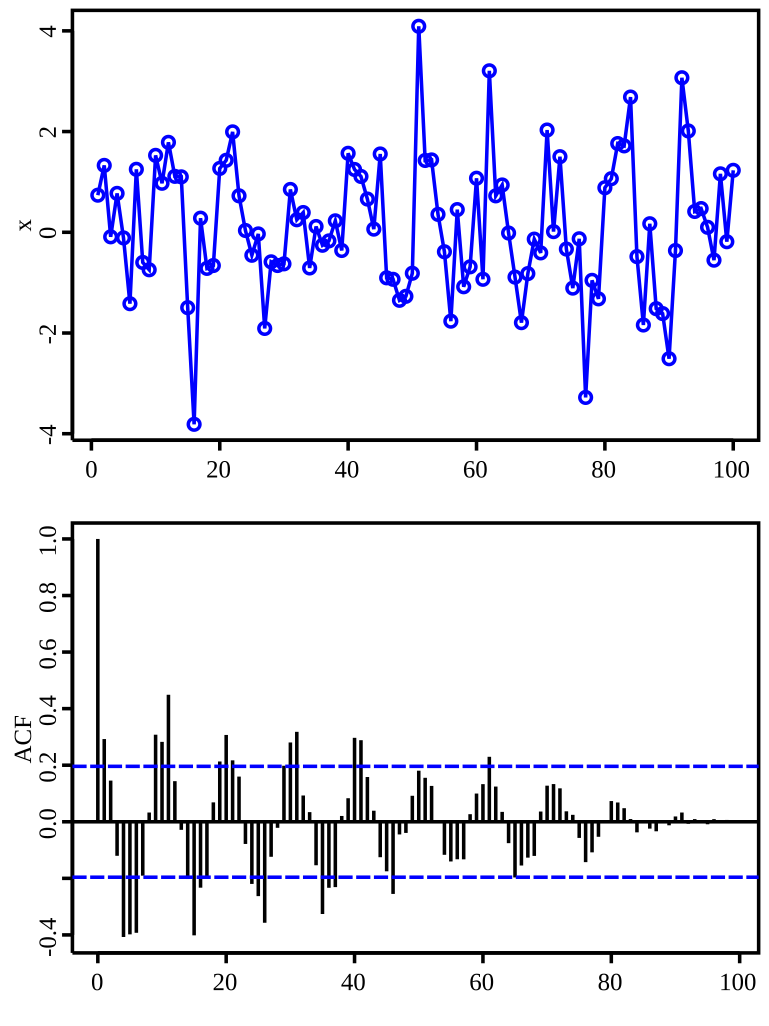
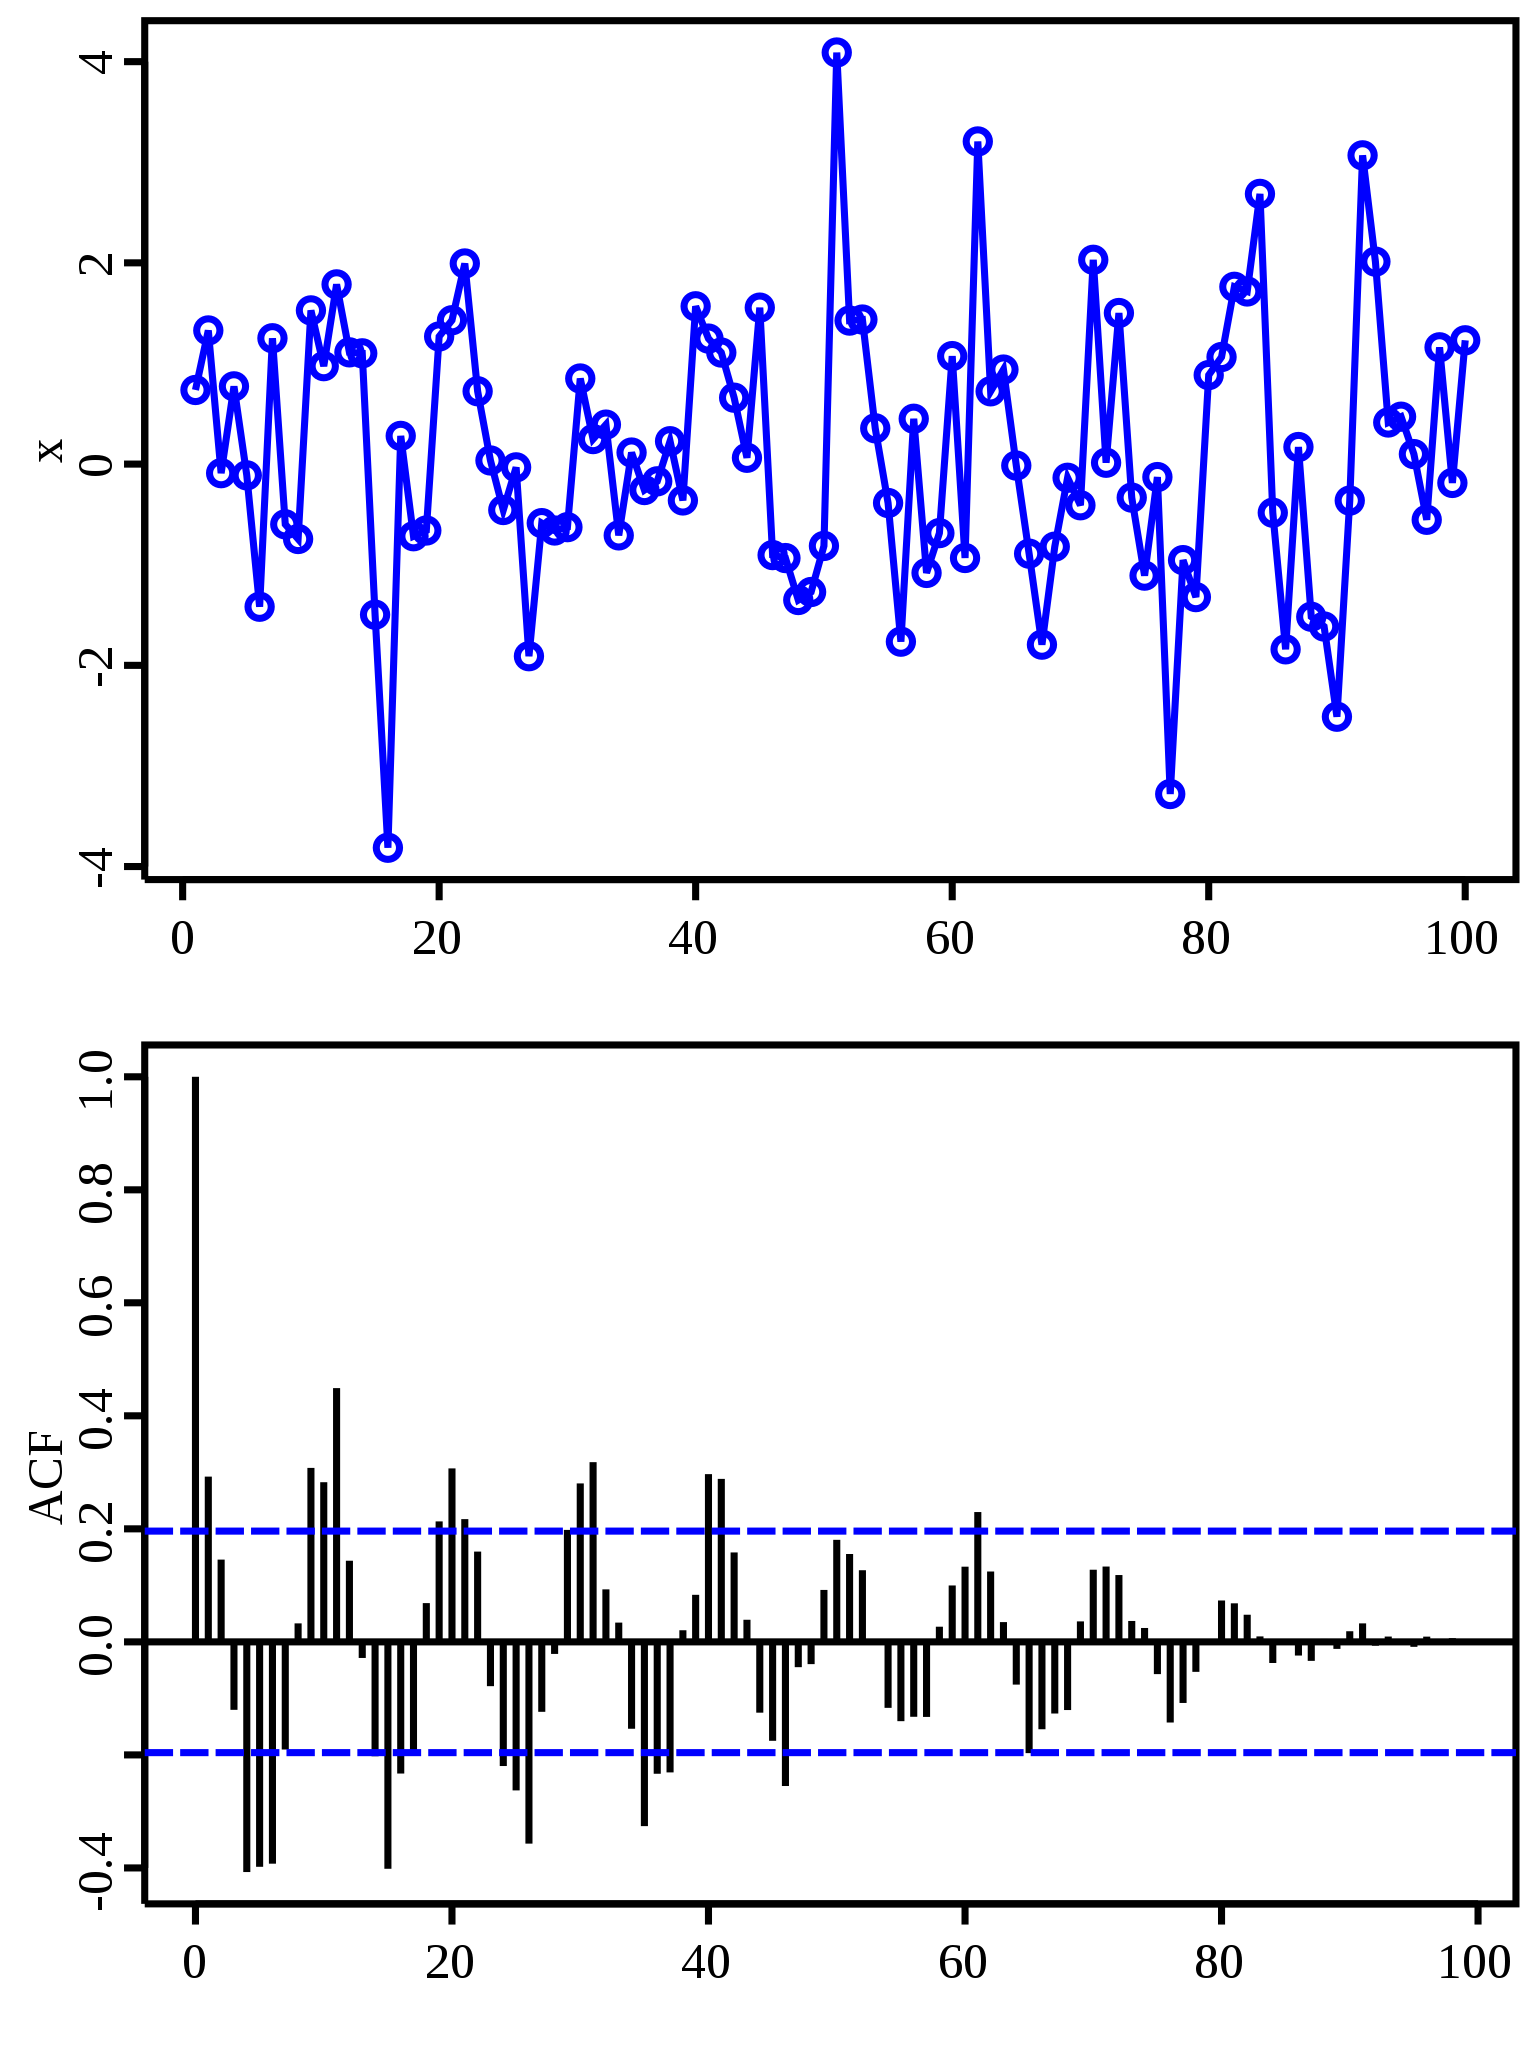
Above: A plot of a series of 100 random numbers concealing a sine function. Below: The sine function revealed in a correlogram produced by autocorrelation.
Summary[edit]
| Description |
English: An image of random numbers, with a hidden sine function, with a wavelength every 10 units. The bottom image shows the autocorrelation (using plot.acf). The horizontal dashed lines are the 95% confidence interval, assuming a white noise. |
| Date | |
| Source | Own work |
| Author | M. W. Toews |
Licensing[edit]
This file is licensed under the Creative Commons Attribution 4.0 International license.
- You are free:
- to share – to copy, distribute and transmit the work
- to remix – to adapt the work
- Under the following conditions:
- attribution – You must give appropriate credit, provide a link to the license, and indicate if changes were made. You may do so in any reasonable manner, but not in any way that suggests the licensor endorses you or your use.
File history
Click on a date/time to view the file as it appeared at that time.
| Date/Time | Thumbnail | Dimensions | User | Comment | |
|---|---|---|---|---|---|
| current | 23:15, 9 July 2007 | | 217 × 289 (50 KB) | Mwtoews (talk | contribs) | == Summary == An image of random numbers, with a hidden sine function, with a wavelength every 10 units. The bottom image shows the autocorrelation. Made by User:Mwtoews using the R programming language: library(RSvgDevice) x <- rnorm( |
You cannot overwrite this file.
File usage on Commons
The following page uses this file:
File usage on other wikis
The following other wikis use this file:
- Usage on en.wikipedia.org
- Usage on es.wikipedia.org
- Usage on fa.wikipedia.org
- Usage on fi.wikipedia.org
- Usage on fr.wikipedia.org
- Usage on pt.wikipedia.org
- Usage on sv.wikipedia.org
- Usage on uk.wikipedia.org
- Usage on www.wikidata.org
- Usage on zh-yue.wikipedia.org