File:2016 Ecuador earthquake-IGEPN20160417a-6.jpg
Jump to navigation
Jump to search
Size of this preview: 423 × 599 pixels. Other resolutions: 169 × 240 pixels | 339 × 480 pixels | 896 × 1,268 pixels.
Original file (896 × 1,268 pixels, file size: 294 KB, MIME type: image/jpeg)
Captions
Captions
Add a one-line explanation of what this file represents

|
This geology image could be re-created using vector graphics as an SVG file. This has several advantages; see Commons:Media for cleanup for more information. If an SVG form of this image is available, please upload it and afterwards replace this template with
{{vector version available|new image name}}.
It is recommended to name the SVG file “2016 Ecuador earthquake-IGEPN20160417a-6.svg”—then the template Vector version available (or Vva) does not need the new image name parameter. |


Summary[edit]
| Description |
English: Please check the following translation against the spanish original, then remove _this_ sentence.
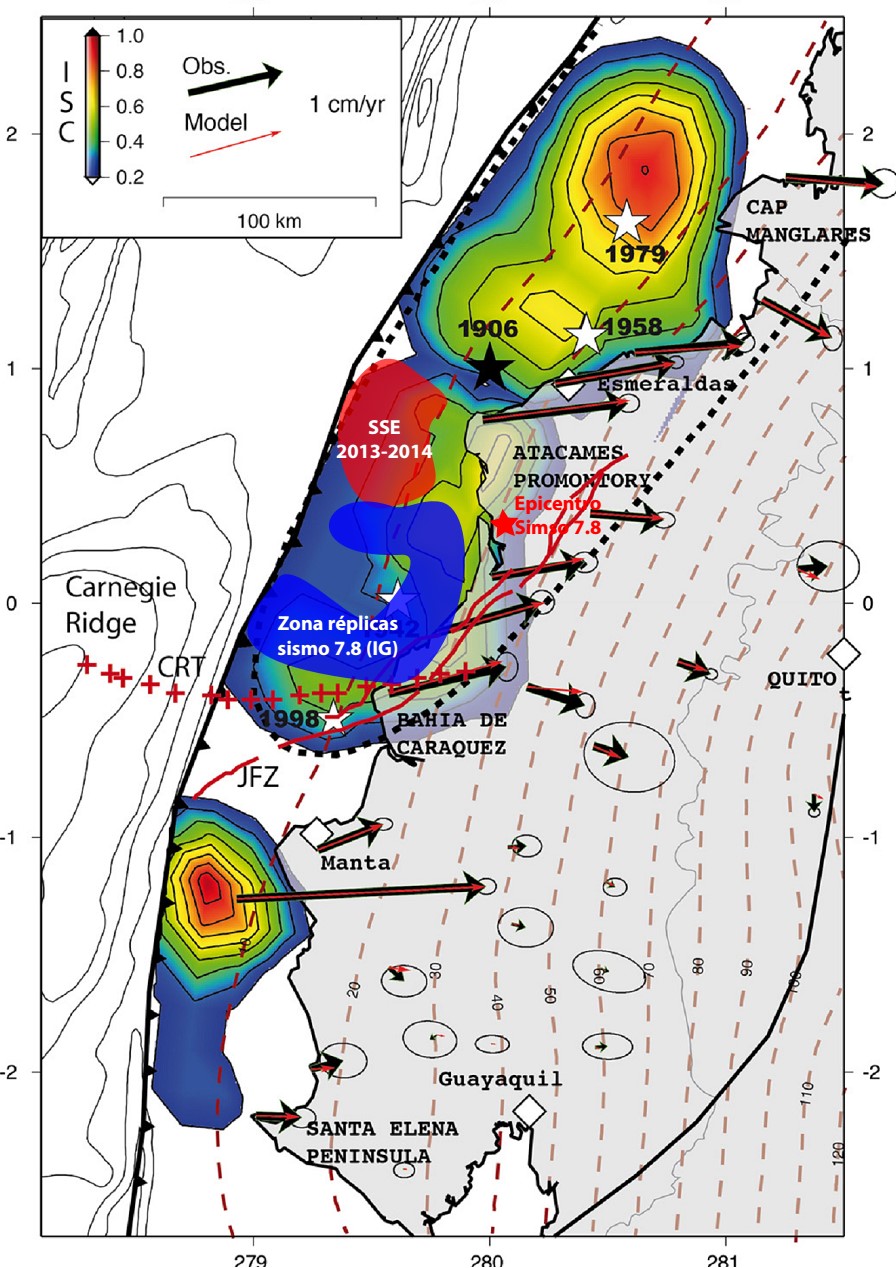
The map shows the accumulation of energy in the coastal zone (ISC Interseismic Coupling). The most intense red shows the zones with highest deformations. The stars are marking previous earthquakes, the red one is the epicenter of the 2016 april 16 quake. The location of the current aftershocks is also shown. The red stain indicates the area of "slow earthquake" between 2013-2014. The red arrows show the model-estimated move and the black arrows the observations obtained by the GPS (From Chlieh et al, 2014)Español: Se observa la acumulación de energía en la zona costera. ISC Interseismic Coupling (Acoplamiento Inter Sísmico). Los colores más rojizos muestran las zonas con mayor acumulación de deformaciones. Las estrellas marcan la ubicación de los sismos históricos en la zona, la estrella roja muestra el epicentro del evento del 16 de abril. Se muestra también la ubicación de las réplicas actuales. La mancha roja indica la zona en la que se presentó un “sismo lento” entre 2013-2014. Las flechas rojas muestran la velocidad estimada por el modelo de cálculo y las flechas negras muestran las observaciones obtenidas por los GPS (Tomado de Chlieh et al, 2014)
Deutsch: Die Karte zeigt die Energieverteilung in der Küstenzone (ISC Interseismic Coupling). Die intensivste Rotfärbung kennzeichnet die Zonen mit den stärksten Deformationen. Die Sterne bezeichnen historische Erdbeben, der rote Stern kennzeichnet das Epizentrum des Bebens vom 16. April. Dargestellt sind auch die Orte aktueller Nachbeben. Der rote Fleck in der Mitte zeigt die Zone eines „langsamen Bebens“ von 2013 bis 2014. Die roten Pfeile zeigen die laut Rechenmodell geschätzten Geschwindigkeiten und die schwarzen Pfeile die Beobachtungen laut GPS (Tomado de Chlieh u. a., 2014) |
| Date | |
| Source | http://www.igepn.edu.ec/servicios/noticias/1317-informe-sismico-especial-n-13-2016 >FILE |
| Author | igepn.edu.ec |
Licensing[edit]
| This work is ineligible for copyright and therefore in the public domain because it consists entirely of information that is common property and contains no original authorship. |
File history
Click on a date/time to view the file as it appeared at that time.
| Date/Time | Thumbnail | Dimensions | User | Comment | |
|---|---|---|---|---|---|
| current | 17:26, 19 April 2016 | | 896 × 1,268 (294 KB) | Itu (talk | contribs) | {{Information |Description ={{en|1=Se observa la acumulación de energía en la zona costera. ISC Interseismic Coupling (Acoplamiento Inter Sísmico). Los colores más rojizos muestran las zonas con mayor acumulación de deformaciones. Las estrellas... |
You cannot overwrite this file.
File usage on Commons
The following page uses this file:
File usage on other wikis
The following other wikis use this file:
- Usage on de.wikipedia.org
- Usage on ru.wikipedia.org