File:DK opinion polls 2011 election.png
Jump to navigation
Jump to search
No higher resolution available.
DK_opinion_polls_2011_election.png (778 × 487 pixels, file size: 9 KB, MIME type: image/png)
Captions
Captions
Add a one-line explanation of what this file represents
Summary
[edit]
| Description |
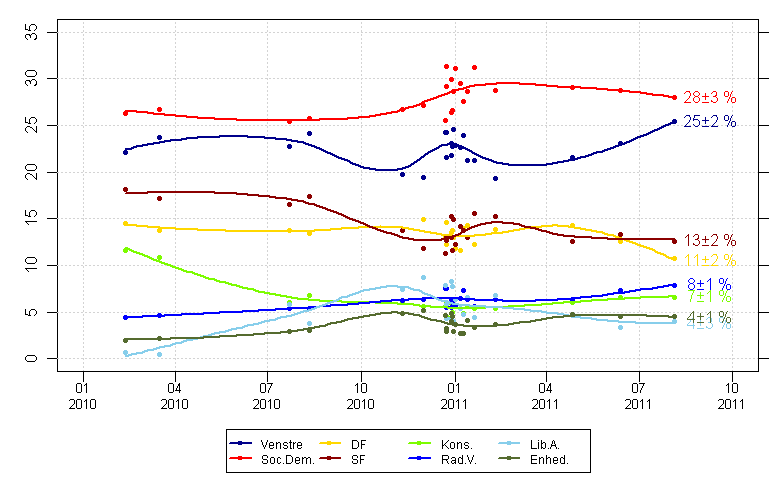
English: Graph showing support for political parties in Denmark since the start of 2010.Data is obtained from the Wikipedia page [1] |
| Date | |
| Source | Own work |
| Author | Mark Payne |
Figure is produced using the R statistical package, using the following code. It first reads the HTML directly from the website, then parses the data and saves the graph into your working directory. It should be able to be run directly by anyone with R.
rm(list=ls())

#Parameters
party.names <- c("Venstre","Soc.Dem.","DFP","SF","Kons.","Rad.V.","Lib.A.","Enhed.","KD")
parties.to.plot <- party.names[1:8]
party.cols    <- c("darkblue","red","gold","darkred","lawngreen","blue","darkolivegreen")
ylims <- c(0,35)
xlims <- c(ISOdate(2010,1,15),ISOdate(2011,10,15))
ticks <- ISOdate(rep(c(2010,2011),each=4),rep(c(1,4,7,10),times=2),15)

#Load the complete HTML file into memory
html <- readLines(url("http://en.wikipedia.org/wiki/Danish_parliamentary_election,_2011"),encoding="UTF-8")
closeAllConnections()

#Extract the opinion poll data table
tbl.no <- 6
tbl <- html[][tbl.no]):(grep("</table.*",html)[tbl.no])]

#Now split it into the rows, based on the <tr> tag
tbl.rows <- list()
open.tr <- grep("<tr",tbl)
close.tr <- grep("</tr",tbl)
for(i in 1:length(open.tr)) tbl.rows[[i]] <- tbl[][i]:close.tr[i]

#Throwout items that are headers or extra info
tbl.rows <- tbl.rows[sapply(tbl.rows,function(x) length(grep("<td",x)))>1]

#Now extract the data
survey.dat <- lapply(tbl.rows,function(x) {
  #Start by only considering where we have <td> tags
  td.tags <- x[grep("<td",x)]
  #Polling data appears in columns 3-10
  dat     <- td.tags[4:12]
  #Now strip the data and covert to numeric format
  dat     <- gsub("<td>|</td>","",dat)
  dat     <- gsub("<b>|</b>","",dat)
  dat     <- gsub("%","",dat)
  dat     <- gsub("-","0",dat)
  dat     <- as.numeric(dat)
  dat     <- ifelse(is.na(dat),0,dat)
  names(dat) <- party.names
  #Getting the date strings is a little harder. Start by tidying up the dates
  date.str <- td.tags[2]                        #Dates are in the second column
  date.str <- gsub("<td>|</td>","",date.str)  #Throw out any tags

  #And finally the survey time
  survey.time <- as.POSIXct(strptime(date.str,format="%Y-%m-%d"))
  #Get the name of the survey company too
  survey.comp <- td.tags[1]
  survey.comp <- gsub("<sup.*</sup>","",survey.comp)
  survey.comp <- gsub("<td>|</td>","",survey.comp)
  survey.comp <- gsub("<U+2013>","-",survey.comp,fixed=TRUE)
  survey.comp <- gsub("(?U)<.*>","",survey.comp,perl=TRUE)

  #And now return results
  return(data.frame(Company=survey.comp,Date=survey.time,date.str,t(dat)))
})

#Combine results
surveys <- do.call(rbind,survey.dat)

#Subset data to only plot selected parties in time window
polls   <- surveys[,c("Company","Date",parties.to.plot)]
polls <- subset(polls,!is.na(polls$Date) )
polls <- subset(polls,polls$Date>=min(xlims) )
polls <- polls[order(polls$Date),]
polls$date.num  <- as.double(polls$Date)

#Setup plot
png("DK_opinion_polls_2011_election.png",width=778,height=487,pointsize=16)
par(mar=c(3,4,1,1),oma=c(3,0,0,0))
matplot(polls$date.num,polls[,parties.to.plot],pch=NA,xlim=xlims,ylab="Party support (%)",xlab="",
  col=party.cols,xaxt="n",ylim=ylims)
abline(h=seq(0,95,by=5),col="lightgrey",lty=3)
abline(v=as.double(ticks),col="lightgrey",lty=3)
axis(1,at=as.double(ticks),labels=format(ticks,format="%b\n%Y"),cex.axis=0.8)
axis(4,at=axTicks(4),labels=rep("",length(axTicks(4))))

#Now calculate the loess smoothers and add the confidence interval
smoothed <- list()
predict.x <- seq(min(polls$date.num),max(polls$date.num),length.out=100)
for(i in 1:length(parties.to.plot)) {
  smoother <- loess(polls[][i] ~ polls[,"date.num"],span=0.75)
  smoothed[[i]] <- predict(smoother,newdata=predict.x,se=TRUE)
#  polygon(c(predict.x,rev(predict.x)),
#    c(smoothed[[i]]$fit+smoothed[[i]]$se.fit*1.96,rev(smoothed[[i]]$fit-smoothed[[i]]$se.fit*1.96)),
#    col=rgb(0.5,0.5,0.5,0.5),border=NA)
}
names(smoothed) <- parties.to.plot
#Then add the data points
matpoints(polls$date.num,polls[,parties.to.plot],pch=20,col=party.cols)
#And finally the smoothers themselves
for(i in 1:length(parties.to.plot)) {
  lines(predict.x,smoothed[[i]]$fit,col=party.cols[i],lwd=2)
}

legend(grconvertX(0.5,"npc"),grconvertY(0,"nfc"),legend=parties.to.plot,col=party.cols,
    pch=20,bg="white",lwd=2,ncol=ceiling(length(parties.to.plot)/2),cex=0.75,xpd=NA,xjust=0.5)

#Add best estimates
for(i in 1:length(smoothed)) {
  lbl <- sprintf("%2.0f ± %1.0f",round(rev(smoothed[[i]]$fit)[1],0),round(1.96*rev(smoothed[[i]]$se.fit)[1],0))
  text(rev(polls$date.num)[1],rev(smoothed[[i]]$fit)[1],labels=lbl,pos=4,col=party.cols[i])
}
dev.off()
Licensing
[edit]
I, the copyright holder of this work, hereby publish it under the following license:
This file is licensed under the Creative Commons Attribution-Share Alike 3.0 Unported license.
- You are free:
- to share – to copy, distribute and transmit the work
- to remix – to adapt the work
- Under the following conditions:
- attribution – You must give appropriate credit, provide a link to the license, and indicate if changes were made. You may do so in any reasonable manner, but not in any way that suggests the licensor endorses you or your use.
- share alike – If you remix, transform, or build upon the material, you must distribute your contributions under the same or compatible license as the original.
File history
Click on a date/time to view the file as it appeared at that time.
| Date/Time | Thumbnail | Dimensions | User | Comment | |
|---|---|---|---|---|---|
| current | 19:59, 22 August 2011 | | 778 × 487 (9 KB) | Trevva (talk | contribs) | Updated to include latest results |
| 09:16, 2 March 2011 |  | 778 × 487 (8 KB) | Trevva (talk | contribs) | Fixed error with colours of the various parties | |
| 09:00, 2 March 2011 |  | 778 × 487 (8 KB) | Trevva (talk | contribs) | Updated figure to include 24 February polls. Corrected abbreviation for Dansk Folksparti to DF | |
| 13:49, 17 February 2011 |  | 778 × 487 (8 KB) | Trevva (talk | contribs) | Added % symbols | |
| 13:40, 17 February 2011 |  | 778 × 487 (8 KB) | Trevva (talk | contribs) | Internationalised figure, so that it is does not contain any english or danish. | |
| 12:53, 17 February 2011 |  | 778 × 487 (8 KB) | Trevva (talk | contribs) | {{Information |Description ={{en|1=Graph showing support for political parties in Denmark since the start of 2010.Data is obtained from the Wikipedia page http://en.wikipedia.org/wiki/Danish_parliamentary_election,_2011}} |Source =Own work |
You cannot overwrite this file.
File usage on Commons
There are no pages that use this file.
File usage on other wikis
The following other wikis use this file:
- Usage on en.wikibooks.org
- Usage on fi.wikipedia.org