Logic diagram
Logic diagrams are diagrams in the field of logic, used for representation and to carry out certain types of reasoning.

containing 16 Venn diagrams
Basics, Tables[edit]
Begriffsschrift[edit]
Begriffsschrift is a a formula language for logic set out in the 1879 book Begriffsschrift by Gottlob Frege. See Category:Begriffsschrift


Carroll diagrams[edit]
A Carroll diagram is a logic diagram used for grouping things in a yes/no fashion. Numbers or objects are either categorised as 'x' (having an attribute x) or 'not x' (not having that attribute). See Category:Carroll diagrams


Karnaugh maps[edit]
The Karnaugh map, also known as a Veitch diagram (KV-map or K-map for short), is a tool to facilitate the simplification of Boolean algebra IC expressions. See also Category:Karnaugh maps


Operation tables in logic[edit]
See Category:Operation tables in logic


Truth tables[edit]
A Truth table is a mathematical table used in logic to compute the functional values of logical expressions on each of their functional arguments, that is, on each combination of values taken by their logical variables. See Category:Truth tables.


Graphs, Networks, Trees[edit]
Argument maps[edit]
An Argument map is a visual representation of the structure of an argument in informal logic. It includes the components of an argument such as a main contention, premises, co-premises, objections, rebuttals and lemmas. See Category:Argument maps


Binary decision diagrams[edit]
A Binary decision diagrams in the field of logic, like a negation normal form or a propositional directed acyclic graph, is a data structure that is used to represent a Boolean function. See Category:Binary decision diagrams


Concept maps[edit]
A concept map is a logic diagram showing the relationships among concepts. See Category:Concept maps


Conceptual graphs[edit]
Conceptual graphs give a formalized representation of natural language is based on semantic networks and Peirce's existential graphs, see Category:Conceptual graphs
Existential graph[edit]
Existential graph is a graphical representation of propositional logic, proposed by Charles Sanders Peirce, who wrote his first paper on graphical logic in 1882 and continued to develop the method until his death in 1914. See Category:Existential graphs


Hasse diagram[edit]
A Hasse diagram is a diagram in the order theory, which is a simple picture of a finite partially ordered set, forming a drawing of the transitive reduction of the partial order, see Category:Hasse diagrams


Implication diagrams[edit]
A logical implication, in logic and mathematics, is a logical relation that holds between a set T of formulae and a formula B when every model or interpretation or valuation of T is also a model of B. See Category:Implication diagrams

Kripke models[edit]
Kripke models are diagrams made for modal logics, and later adapted to intuitionistic logic and other non-classical systems. See Category:Kripke models


Logic gates[edit]


Porphyrian tree[edit]
A Porphyrian tree, created by the Phoenician Neoplatonic philosopher Porphyry (233–309 AD.), is a hierarchical ontology, construction in logic consisting of three rows or columns of words; the middlemost whereof contains the series of genus and species, and bears some analogy to the trunk.
.png)
_using_A_porphyrii_structure.png)

Semantic tableau[edit]
The semantic tableau is a logic diagram, which shows a decision procedure for sentential and related logics, and a proof procedure for formulas of first-order logic. See Category:Semantic tables


Sets[edit]
Edward's Venn diagrams[edit]
Edward's Venn diagrams are diagrams, that represent higher numbers of sets that features some symmetries. This construction developed by A.W.F. Edwards is achieved by projecting the Venn diagram onto a sphere. See Category:Edward's Venn diagrams


Euler diagrams[edit]
Euler diagrams are diagrams used to illustrate reasoning. See Category:Euler diagrams
-
 Transformation of Venn into Euler Diagrams
 -

-

-


Spider diagram[edit]
A spider diagram adds existential points to an Euler or a Venn diagram. See Category:Spider diagrams

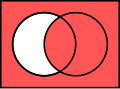
Venn diagram[edit]
Venn diagrams are illustrations that show all kind of the possible mathematical or logical relationships between sets, groups of things. See Category:Venn diagrams.


Related categories: Economic, Physical and Political Venn diagrams
- Venn diagrams in propositional logic
In some Venn diagrams all areas are marked with binary zeros (for false) and ones (for true), which may be represented by white and red. Logically these diagrams are equivalent to truth tables. Sometimes, they are called Johnston diagrams, but the article w:Johnston diagram has been deleted, because this term is unusual. On Commons the category is still Category:Johnston diagrams.
-
 contradiction
 -
 A and B
 -
 (not A) or B
 -
 tautology


- Venn diagrams in predicate logic
The validity of a syllogism can be proofed by a 3 circle Venn diagram, by marking areas, which are known to contain either none or some elements. In the following examples empty areas are marked in black, and areas with at least one element are marked in red. See: Category:3 circle Johnston diagrams
-
 Modus Barbara
 -
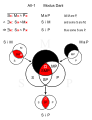 Modus Darii
 -
 Modus Barbari
 -
 Modus Darapti


