File:White noise spectrum.png
Jump to navigation
Jump to search
No higher resolution available.
White_noise_spectrum.png (800 × 600 pixels, file size: 5 KB, MIME type: image/png)
Captions
Captions
Add a one-line explanation of what this file represents
Summary[edit]
| Description |
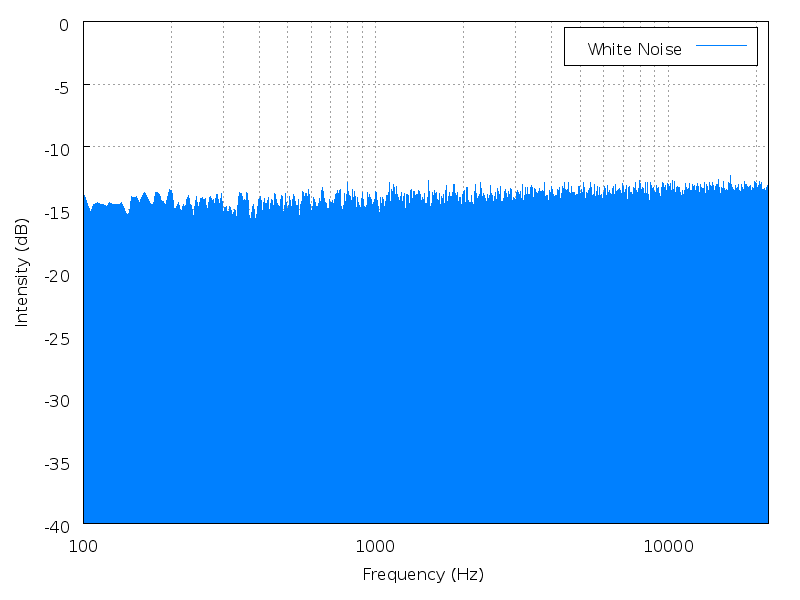
English: Spectrum analysis of uncompressed source for 10 seconds of white noise. Note the logarithmic frequency scale.
The analysis was done using Audacity, and plotting with gnuplot. Transparency was touched up in GIMP to make the graph background pure white. (I find the log frequency plot here confusing, as it suggests that white noise may rise slightly with increasing frequency. A linear frequency scale would be better. However, for comparison with pink noise, having the log frequency plot keeps the frequency axis on both the same.) |
|||
| Date | ||||
| Source | Own work | |||
| Author | Javg (talk · contribs) | |||
| Other versions |
|


Instructions[edit]
Obtain the frequency analysis from Audacity, set the maximum number of windows, and use a Hamming window. The following script was used to generate the image:
This plot was created with Gnuplot.
Licensing[edit]
| I, the copyright holder of this work, release this work into the public domain. This applies worldwide. In some countries this may not be legally possible; if so: I grant anyone the right to use this work for any purpose, without any conditions, unless such conditions are required by law. |
File history
Click on a date/time to view the file as it appeared at that time.
| Date/Time | Thumbnail | Dimensions | User | Comment | |
|---|---|---|---|---|---|
| current | 12:54, 26 November 2006 | | 800 × 600 (5 KB) | Javg (talk | contribs) | == Summary == Spectrum analysis of uncompressed source for {{Audio|White noise.ogg|10 seconds of white noise}}. Note the logarithmic frequency scale. The analysis was done using Audacity, and plotting with gnuplot. Transparency was touched up in |
You cannot overwrite this file.
File usage on Commons
The following page uses this file:
File usage on other wikis
The following other wikis use this file:
- Usage on ast.wikipedia.org
- Usage on bg.wikipedia.org
- Usage on cs.wikipedia.org
- Usage on cv.wikipedia.org
- Usage on en.wikipedia.org
- Usage on eo.wikipedia.org
- Usage on es.wikipedia.org
- Usage on fr.wikipedia.org
- Usage on hu.wikipedia.org
- Usage on hy.wikipedia.org
- Usage on ja.wikipedia.org
- Usage on kk.wikipedia.org
- Usage on lt.wikipedia.org
- Usage on ru.wikipedia.org
- Usage on uk.wikipedia.org
- Usage on uz.wikipedia.org
- Usage on zh.wikipedia.org