File:Sine wavelength.svg
Jump to navigation
Jump to search

Size of this PNG preview of this SVG file: 512 × 356 pixels. Other resolutions: 320 × 223 pixels | 640 × 445 pixels | 1,024 × 712 pixels | 1,280 × 890 pixels | 2,560 × 1,780 pixels.
Original file (SVG file, nominally 512 × 356 pixels, file size: 26 KB)
Captions
Captions
high resolution
Summary[edit]
| Description |
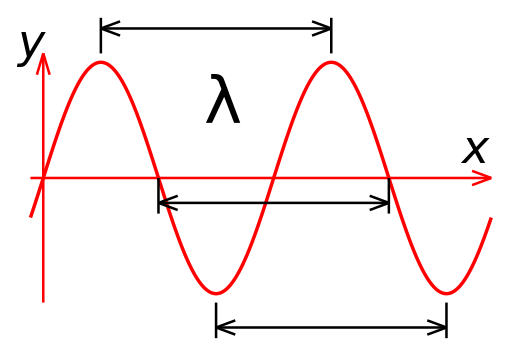
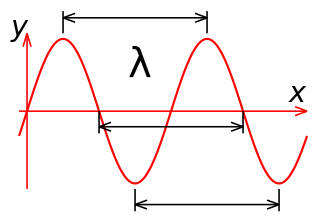
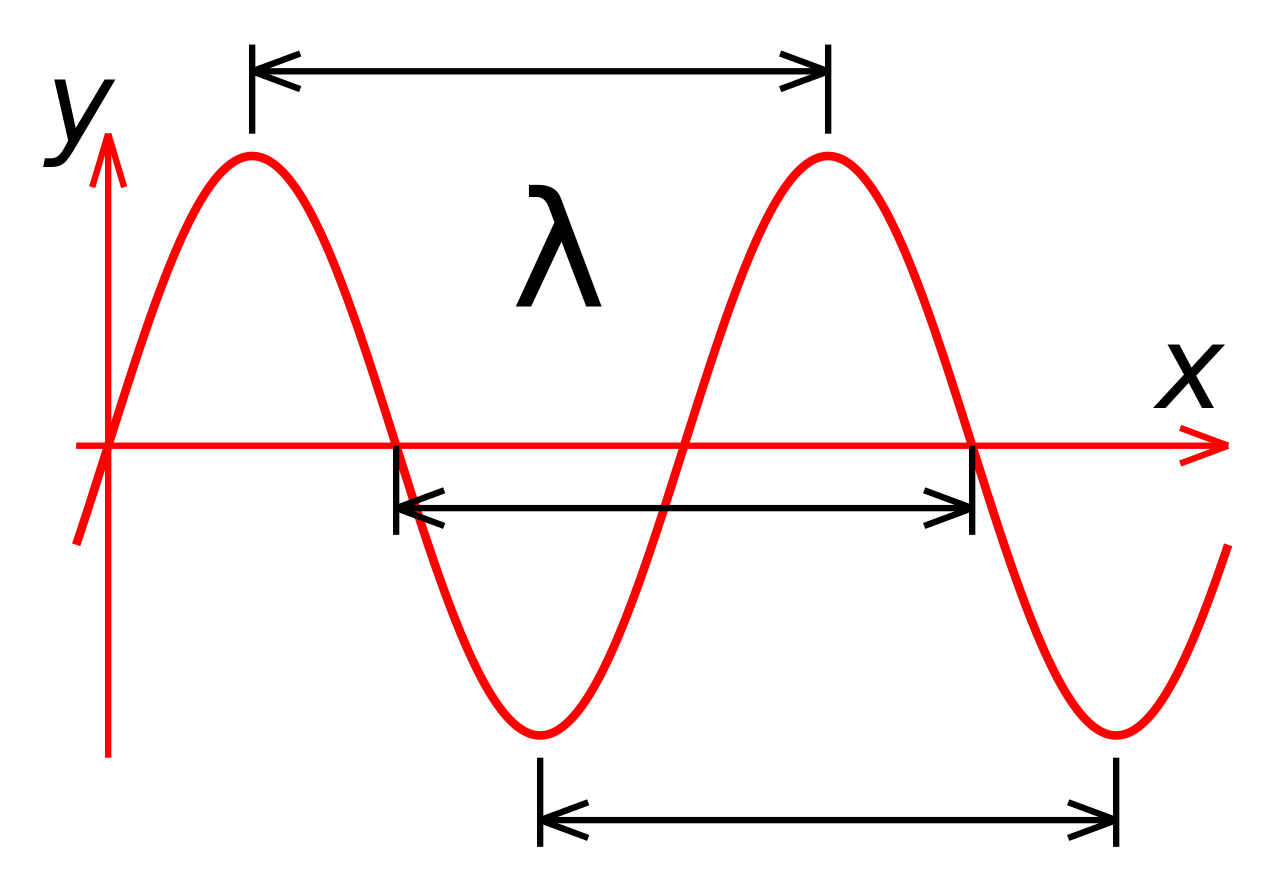
English: Plot of a sine wave, showing three pairs of corresponding points between which wavelength (lambda) can be measured. |
| Date | |
| Source | Own work |
| Author | Dicklyon (Richard F. Lyon) |
Licensing[edit]
I, the copyright holder of this work, hereby publish it under the following license:
This file is licensed under the Creative Commons Attribution-Share Alike 3.0 Unported license.
- You are free:
- to share – to copy, distribute and transmit the work
- to remix – to adapt the work
- Under the following conditions:
- attribution – You must give appropriate credit, provide a link to the license, and indicate if changes were made. You may do so in any reasonable manner, but not in any way that suggests the licensor endorses you or your use.
- share alike – If you remix, transform, or build upon the material, you must distribute your contributions under the same or compatible license as the original.
Source (Asymptote)[edit]
import graph;
size(200,100,IgnoreAspect);

real f(real x) {
  return sin(2*pi*x);
}

string fmt(real x) {
  return "";
}

draw(graph(f, 0, 2, operator..), red);
xaxis("$x$",Ticks(N=0,n=4,Step=0.5,ticklabel=fmt));
yaxis("$y(x)$",Ticks(N=0,n=4,Step=1, ticklabel=fmt));

Label lambda=Label("$\lambda$",align=N,blue);
draw(L=lambda, (0.25, 1) -- (1.25, 1), blue, Arrows);
draw(L=lambda, (0.50, 0) -- (1.50, 0), blue, Arrows);
draw(L=lambda, (0.75,-1) -- (1.75,-1), blue, Arrows);
File history
Click on a date/time to view the file as it appeared at that time.
| Date/Time | Thumbnail | Dimensions | User | Comment | |
|---|---|---|---|---|---|
| current | 10:47, 30 October 2021 | | 512 × 356 (26 KB) | Upload77 (talk | contribs) | Reverted to version as of 06:13, 2 July 2009 (UTC) |
| 21:29, 27 January 2014 |  | 600 × 300 (18 KB) | Patrick87 (talk | contribs) | use generic axes labels (specification of wavelengths on a time or frequency axis as in previous version does not make sense) | |
| 20:54, 5 August 2013 |  | 251 × 125 (25 KB) | Rayhem (talk | contribs) | Clearer markings, Asymptote source code | |
| 06:13, 2 July 2009 |  | 512 × 356 (26 KB) | Dicklyon (talk | contribs) | {{Information |Description={{en|1=Plot of a sine wave, showing three pairs of corresponding points between which wavelength (lambda) can be measured.}} |Source=Own work by uploader |Author=Dicklyon (Richard F. Lyon) |Date=July 1 2009 |Pe |
You cannot overwrite this file.
File usage on Commons
The following page uses this file:
File usage on other wikis
The following other wikis use this file:
- Usage on am.wikipedia.org
- Usage on ar.wikipedia.org
- Usage on ary.wikipedia.org
- Usage on azb.wikipedia.org
- Usage on az.wikipedia.org
- Usage on be-tarask.wikipedia.org
- Usage on be.wikipedia.org
- Usage on bn.wikipedia.org
- Usage on cv.wikipedia.org
- Usage on de.wikipedia.org
- Usage on en.wikipedia.org
- Usage on en.wikibooks.org
- Usage on en.wiktionary.org
- Usage on es.wikipedia.org
- Usage on et.wikipedia.org
- Usage on fi.wiktionary.org
- Usage on fr.wikipedia.org
- Usage on gl.wiktionary.org
- Usage on he.wikipedia.org
- Usage on he.wikibooks.org
- Usage on he.wiktionary.org
- Usage on hr.wikipedia.org
- Usage on ht.wikipedia.org
- Usage on hy.wikipedia.org
- Usage on id.wikipedia.org
- Usage on ja.wikipedia.org
- Usage on ka.wikipedia.org
- Usage on kk.wikipedia.org
- Usage on ko.wikipedia.org
- Usage on la.wikipedia.org
- Usage on lv.wikipedia.org
- Usage on mk.wikipedia.org
- Usage on pa.wikipedia.org
- Usage on pnb.wikipedia.org
- Usage on ps.wikipedia.org
- Usage on ru.wikipedia.org
- Usage on sh.wikipedia.org
- Usage on si.wikipedia.org
- Usage on sl.wikipedia.org
- Usage on so.wikipedia.org
View more global usage of this file.