File:2005salt.PNG
Jump to navigation
Jump to search

Size of this preview: 800 × 351 pixels. Other resolutions: 320 × 140 pixels | 640 × 281 pixels | 1,425 × 625 pixels.
Original file (1,425 × 625 pixels, file size: 60 KB, MIME type: image/png)
Captions
Captions
Add a one-line explanation of what this file represents
Summary[edit]
| Description |
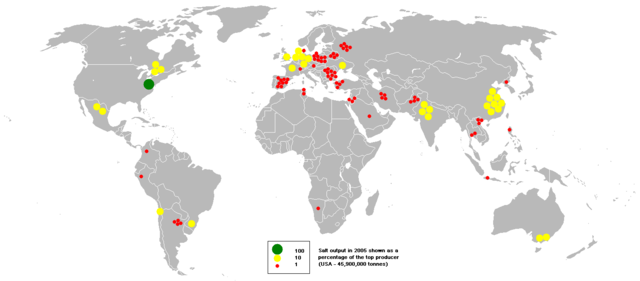
English: This bubble map shows the global distribution of (unrefined) salt output in 2005 as a percentage of the top producer (USA - 45,900,000 tonnes).
This map is consistent with an incomplete set of data too as long as the top producer is known. It resolves the accessibility issues faced by colour-coded maps that may not be properly rendered in old computer screens. Data was extracted on 1st June 2007. Source - http://www.bgs.ac.uk/mineralsuk/commodity/world/home.html Based on Image:BlankMap-World.png |
| Date | |
| Source | english Wikipedia |
| Author | Anwar saadat |
Licensing[edit]
| I, the copyright holder of this work, release this work into the public domain. This applies worldwide. In some countries this may not be legally possible; if so: I grant anyone the right to use this work for any purpose, without any conditions, unless such conditions are required by law. |
File history
Click on a date/time to view the file as it appeared at that time.
| Date/Time | Thumbnail | Dimensions | User | Comment | |
|---|---|---|---|---|---|
| current | 19:04, 13 October 2008 | | 1,425 × 625 (60 KB) | Tamorlan (talk | contribs) | {{Information |Description= {{en|This bubble map shows the global distribution of (unrefined) salt output in 2005 as a percentage of the top producer (USA - 45,900,000 tonnes). This map is consistent with an incomp |
You cannot overwrite this file.
File usage on Commons
The following page uses this file:
File usage on other wikis
The following other wikis use this file:
- Usage on ar.wikipedia.org
- Usage on ast.wikipedia.org
- Usage on bn.wikipedia.org
- Usage on ca.wikipedia.org
- Usage on es.wikipedia.org
- Usage on fa.wikipedia.org
- Usage on gl.wikipedia.org
- Usage on incubator.wikimedia.org
- Usage on pt.wikipedia.org
- Usage on ru.wikipedia.org
- Usage on si.wikipedia.org
- Usage on ta.wikipedia.org
- Usage on te.wikipedia.org
- Usage on ug.wikipedia.org
- Usage on uk.wikipedia.org
- Usage on ur.wikipedia.org
- Usage on zh.wikipedia.org